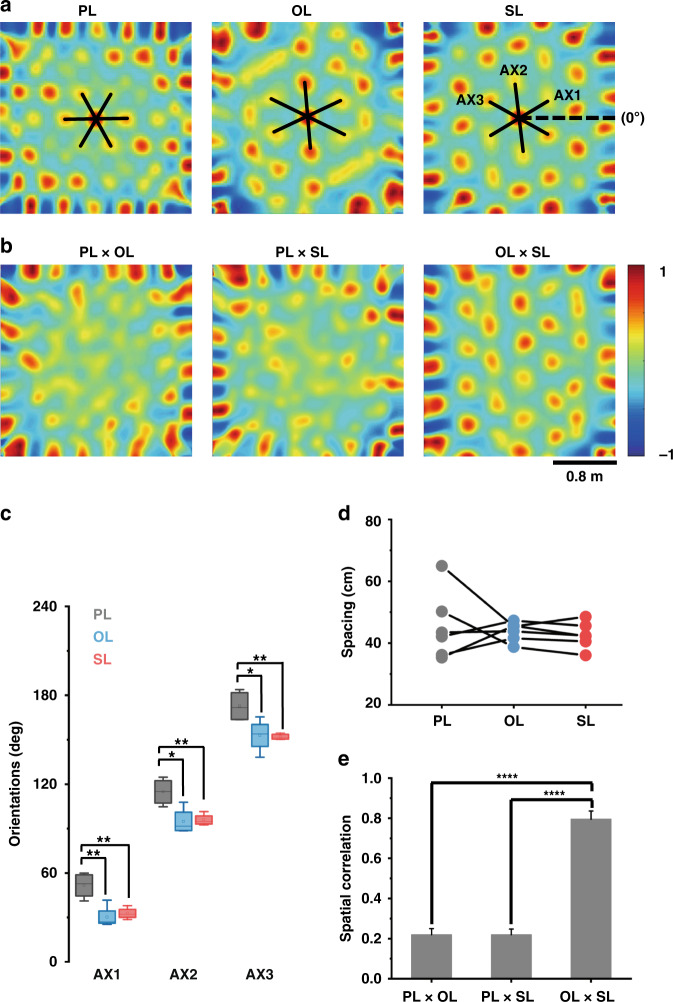
Fig. 5. Global remapping induced by 3D landmarks containing an OL and SL.
a Grid pattern of the spatial autocorrelogram rotates and scales in response to the object and social stimulus. Black solid lines and dashed lines indicate grid axes (AX) in three directions and horizontal reference (0°), respectively. b Cross-correlation maps of grid firing rate matrices for two of the corresponding three trials in (a). c Boxplot showing orientation distribution for three axes of all cells from one rat in three trials (*p < 0.05, **p < 0.01, paired t test, n = 4; center lines, individual medians; boxes, 25th–75th percentile range; whiskers, extreme value). d Statistics of grid spacing responding to three landmarks (n = 6). e Spatial correlation calculated for two spatial autocorrelograms of the innermost hexagonal region under three conditions. (****p < 0.0001, paired t test, n = 6)

