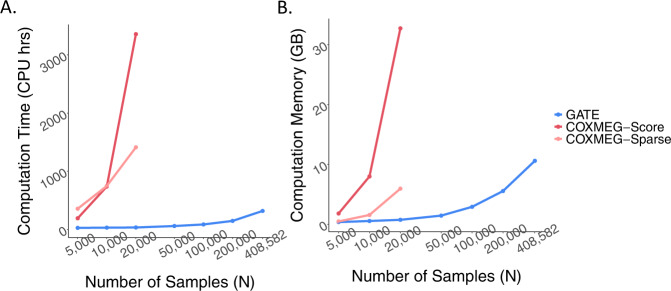
Fig. 1. Projected computation cost for GATE, COXMEG-Score, and COXMEG-sparse as a function of sample size.
A is for computation time and B is for memory usage. The numerical data are provided in Supplementary Table 1. Benchmarking was performed for the GWAS of lifespan based on randomly subsampled data from UK Biobank White British ancestry subjects. Association tests were performed on 200,000 randomly selected markers with imputation INFO ≥ 0.3, with the filtering criteria of MAC ≥ 20. The computation times were projected for testing 46 million variants with INFO ≥ 0.3 and MAC ≥ 20. The reported run times are medians of five runs, each with randomly sampled subjects with different randomization seeds. The x-axis is plotted on a log10 scale.

