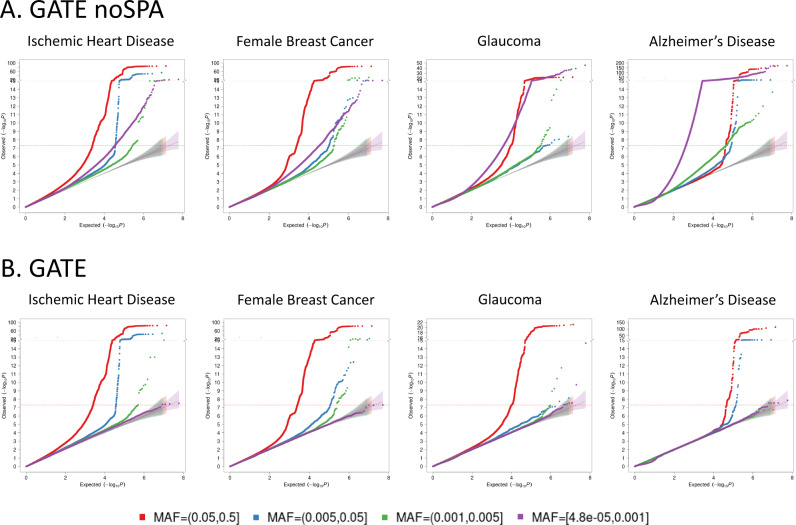
Fig. 3. Quantile–quantile (QQ) plots for GWAS of four time-to-event phenotypes with different censoring rates in the UK Biobank data with White British ancestry.
GWAS results using GATE-noSPA (A) and GATE (B) are shown for ischemic heart disease (PheCode 411, N = 407,776, censoring rate = 90.9%), female breast Cancer (PheCode 174.1, N = 208,160, censoring rate = 92.6%), glaucoma (PheCode 365, N = 398,971, censoring rate = 98.5%), and Alzheimer’s Disease (PheCode 290.11, N = 342,881, censoring rate = 99.8%). QQ plots are color-coded based on different minor allele frequency categories. 95% error bands around the nominal x = y diagonal line are also shown for each MAF category.

