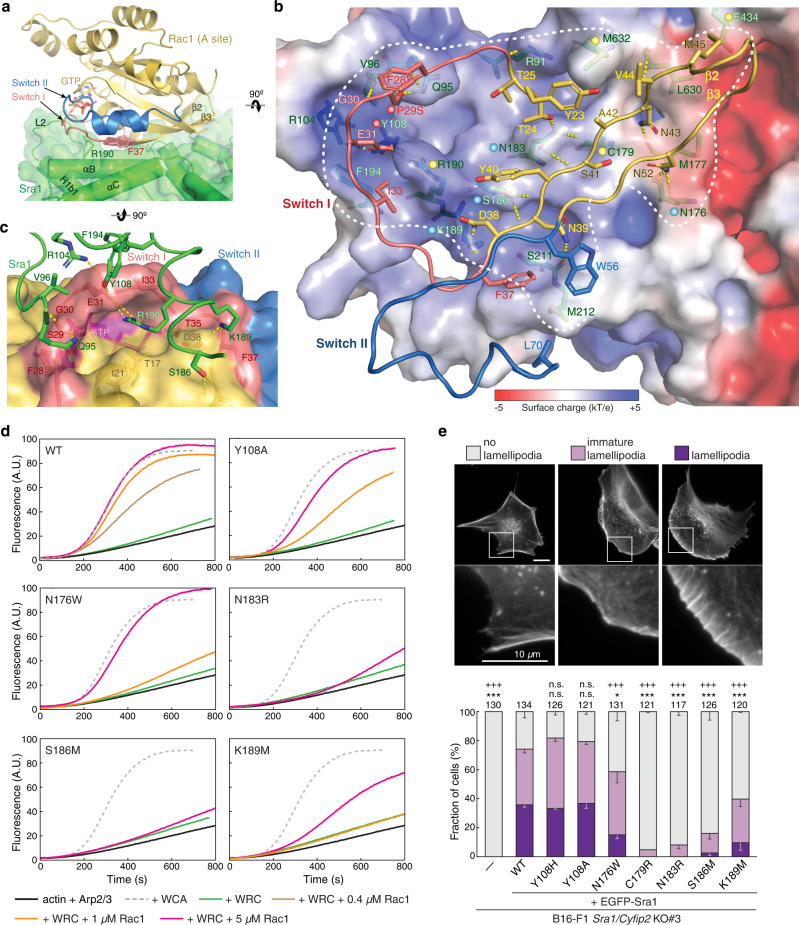
Fig. 3. Interactions mediating Rac1 binding to the A site.
a Side view of the overall structure of Rac1 binding to the A site, using the same color scheme as in Fig. 2. F37 and R190 side chains are shown as reference points. b Top view and semitransparent surface charge representation of the A site, showing key interactions between Sra1 and Rac1. Yellow dotted lines indicate polar interactions. White dashed line indicates binding site boundary. For clarity, the backbone of Rac1 Switch I—β2—β3—Switch II sequence mediating the binding is shown as loops. Dots of different colors indicate residues of which mutations were involved in human disease (red), previously designed and shown to disrupt Rac1 binding (yellow), or newly introduced in this work (blue). c Semitransparent surface representation of the Rac1 surface, showing how Sra1R190 fits into a deep pocket in Rac1 and how it is supported by interactions surrounding the rim of the pocket. d Pyrene-actin polymerization assays measuring the activities of WRCs carrying indicated mutations at the A site. Reactions use the NMEH20GD buffer (see Methods) and contain 3.5 µM actin (5% pyrene-labeled), 10 nM Arp2/3 complex, 100 nM WRC230WCA or WAVE1 WCA, and/or indicated amounts of Rac1QP. e Representative fluorescence images and quantification of lamellipodia formation in B16-F1 Sra1/Cyfip2 double KO#3 cells transfected with indicated EGFP-Sra1 variants and stained by phalloidin for F-actin. Statistical significance was assessed from three repeats for differences between cells transfected with WT (wild type) vs. no (-) or indicated mutant constructs concerning cell percentages displaying “no lamellipodia” phenotype (*p < 0.05; ***p < 0.001) and with “lamellipodia” phenotype (+++p < 0.001) using one-way ANOVA with Dunnett’s post hoc test correcting for multiple comparisons. n.s.: not statistically significant. Error bars represent standard errors of means. Cell numbers used for the quantification are shown on top of each column. Exact p-values (WT vs. X) are No lamellipodia: no (-): <0.0001, Y108H: 0.4733, Y108A: 0.8198, N176W: 0.0240, C179R < 0.0001, N183R < 0.0001, S186M < 0.0001, K189M < 0.0001; and Lamellipodia: no (-): <0.0001, Y108H: 0.9706, Y108A: 0.9995, N176W < 0.0001, C179R < 0.0001, N183R < 0.0001, S186M < 0.0001, K189M < 0.0001. Source data for d, e are provided as a Source Data file.

