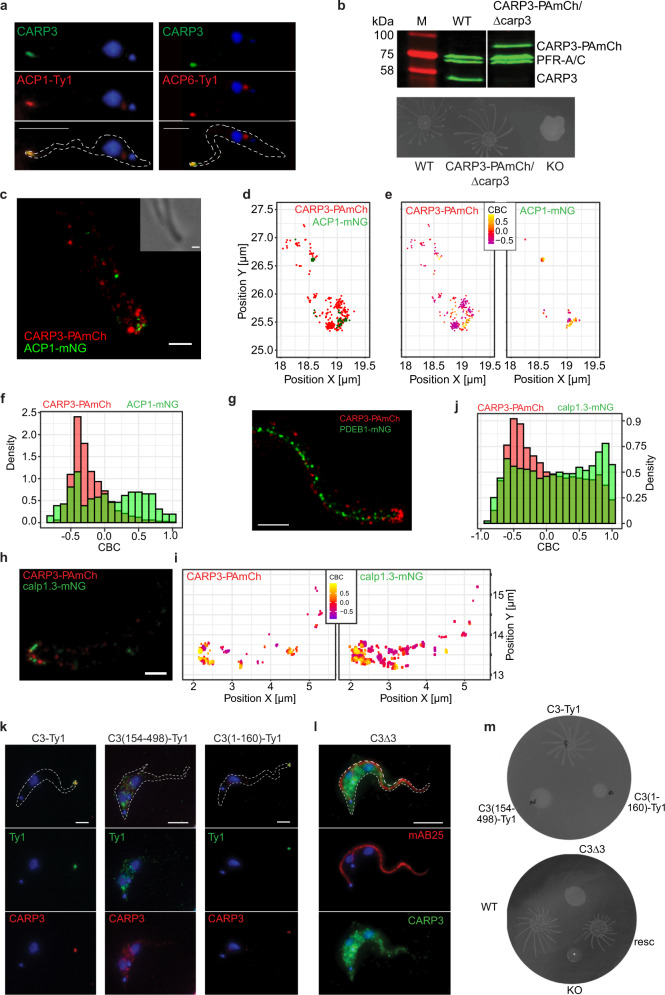
Fig. 2. Super-resolution topology in the flagellar tip microdomain.
a Indirect immunofluorescence analysis of CARP3 and ACP1-Ty1 (left) or ACP6-Ty1 (right) in procyclic T. brucei 29-13. Top: CARP3 (green) + DNA (blue, DAPI); middle: Ty1 (red) + DNA; bottom: merge. Scale bars 5 µm. b Western blot (top, probed with anti-CARP3 and anti-PFR-A/C as loading control) and SoMo assay (bottom) of procyclic T. brucei AnTat 1.1E CARP3-PAmCherry/∆carp3 cells. Wild type (WT) and homozygous carp3 knock-out (KO) serve as controls. M: molecular weight marker. c PALM imaging and (d) single molecule localization shown via centroids of CARP3-PAmCherry (PAmCh, red) and ACP1-mNeonGreen (mNG, green) at a procyclic T. brucei AnTat 1.1E flagellar tip. Corresponding phase contrast shown as inset in (c). Colocalization analysis of CARP3-PAmCherry with ACP1-mNeonGreen (e, f). CARP3 (e, left) and ACP1 (e, right) localizations are color-coded according to their respective Coordinate Based Colocalization (CBC) values, where a higher value signifies a higher colocalization probability. CBC histograms (f) of CARP3-PAmCherry (red) and ACP1-mNeonGreen (green) single molecule distributions. CBC values were calculated in a maximum radius of 300 nm and radius intervals of 5 nm. n = 19 flagella. g PALM imaging of CARP3-PAmCherry (red) and PDEB1-mNeonGreen (green) in a procyclic T. brucei AnTat 1.1E flagellum. PALM imaging (h) and colocalization analysis (i, j) of CARP3-PAmCherry (red) and calpain 1.3-mNG (green) at a procyclic T. brucei AnTat 1.1E flagellar tip. CARP3 (i, left) and calpain 1.3 (i, right) localizations are color-coded according to their CBC values. Scale bars in (c), (g) and (h) 0.5 μm. Quantification in (j) shows CBC histograms of CARP3-PAmCherry (red) and calpain 1.3-mNG (green) single-molecule distributions. n = 15 flagella. k, l Indirect immunofluorescence analysis of CARP3 localization in procyclic T. brucei AnTat 1.1 upon constitutive overexpression of CARP3-Ty1, CARP3(154-489)-Ty1 or CARP3(1-160)-Ty1 or in situ add-back of CARP3∆3 in a carp3 KO background. k Anti-CARP3 red, anti-Ty1 green, DAPI (DNA) blue. (l) mAB25 (anti-TbSAXO) red, anti-CARP3 green. Scale bars 5 μm. m SoMo assay of cell lines as in (k, l) including WT and carp3 KO. Source data to (b) is provided as Source Data file.

