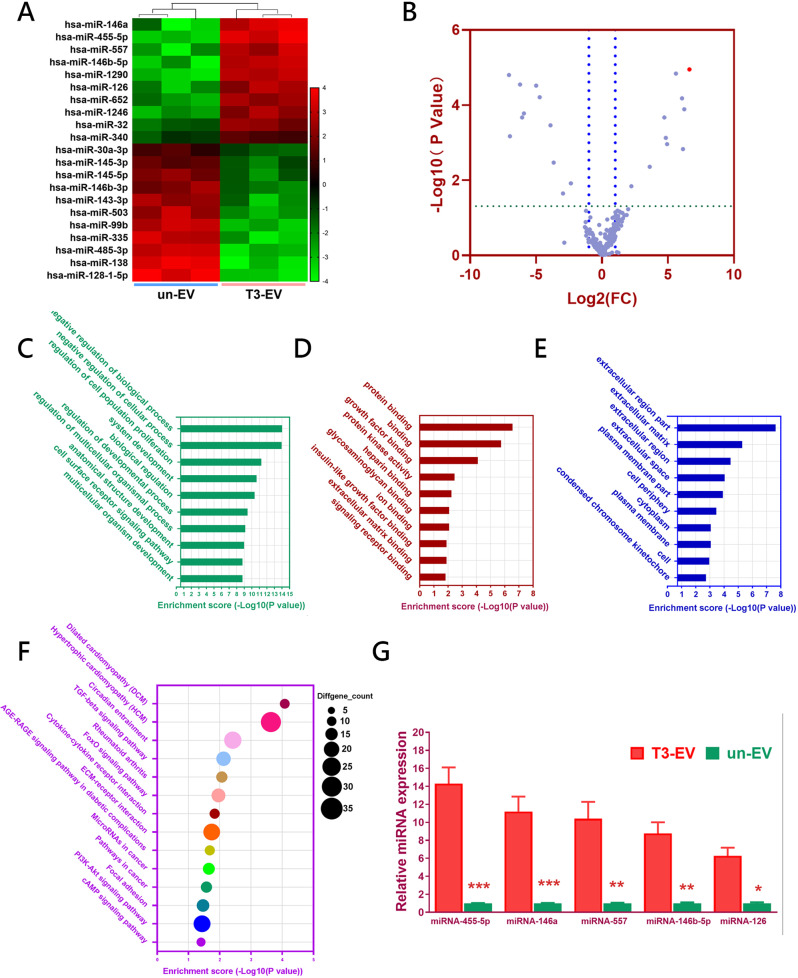
Fig. 2. Discovery of T3-EV-associated miRNAs by microarray.
A Heatmap of clustering dysregulated miRNA expression profiles with microarray in T3-EVs compared to untreated un-EV control. B Volcano plot of miRNA expression profiles and miR-455 (red dot) was most significantly upregulated in T3-EV. C–E All differentially expressed miRNAs(DEG with fold change >2 or <0.5, p value <0.01) were subjected to gene ontology (GO) analysis for C biological processes, D molecular function, and E cellular component. F Significantly enriched pathways for target genes of miRNAs enriched within T3-EV in Kyoto Encyclopedia of Genes and Genomes (KEGG) pathways. G miRNAs expression elevation (n = 3 for each) with the same EVs was validated with qRT-PCR. *P < 0.05, **P < 0.01, ***P < 0.001, NS not significant.

