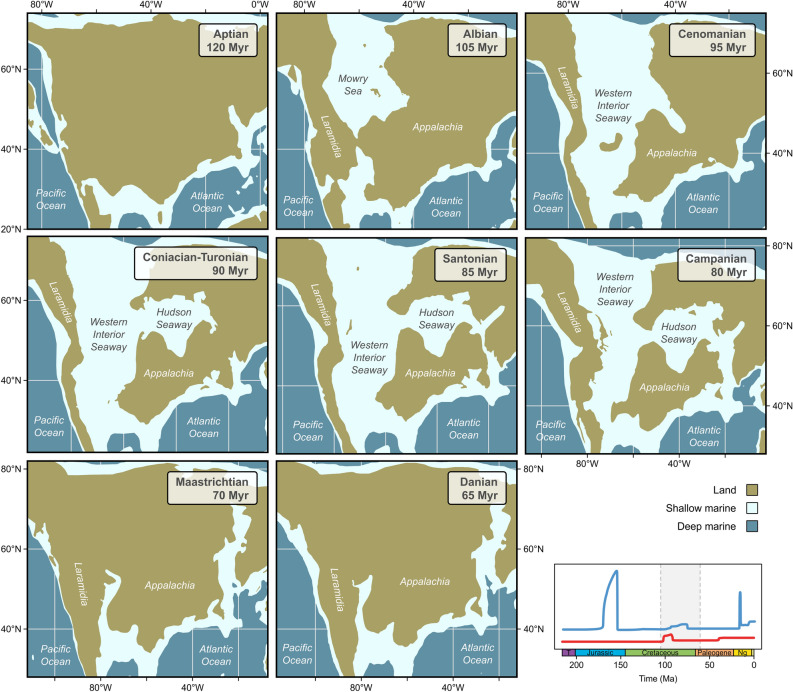
Figure 5.
Paleogeography of North America during the mid-Cretaceous to early Paleocene, showing the major developments and phases of the Western Interior Seaway and adjacent regions. The graph on the bottom right indicates the temporal extent of the Western Interior Seaway and the corresponding shifts in the speciation (blue) and extinction (red) rates (see also Fig. 1). Map was generated in R v. 4.1.2 (https://www.r-project.org/) based on polygons from Ref.27. Region names follow Ref.30.

