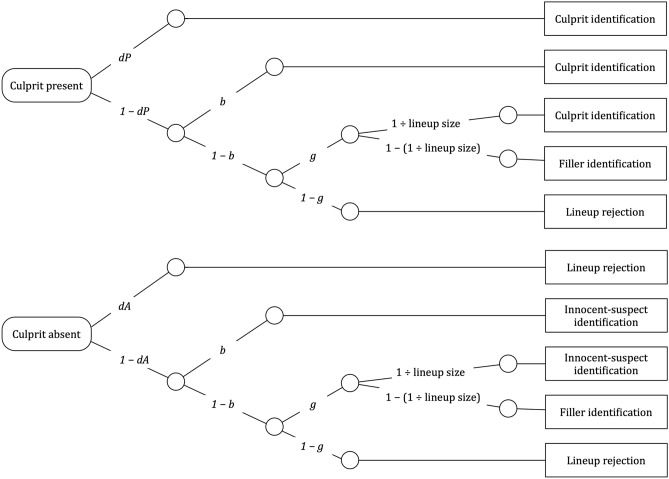
Figure 1.
Graphical illustration of the two-high threshold (2-HT) eyewitness identification model. The rounded rectangles on the left represent culprit-present and culprit-absent lineups that have to be processed in order to arrive at an observable response. The rectangles on the right represent the observable response categories. The letters attached to the branches represent the probabilities of the latent cognitive processes postulated by the model. Parameter dP represents the probability of detecting the presence of the culprit. Parameter b represents the probability of biased selection of a suspect who stands out from the other lineup members. Parameter g represents the probability of guessing-based selection among the lineup members, as a consequence of which the suspect might be chosen based on chance with a probability of 1 ÷ lineup size (approximately 0.16667 in the present case of six lineup members). Parameter dA represents the probability of detecting the absence of the culprit. Identifiability was ensured using multiTree’s30 repeated analysis module in which the expectation–maximization algorithm is repeatedly applied to identical category frequencies (1000 times in the present case for every dataset presented here). Identical parameter estimates were obtained in all cases, confirming that the model is identifiable. There are as many free parameters as there are independent data categories to fit so that the unrestricted model has zero degrees of freedom.

