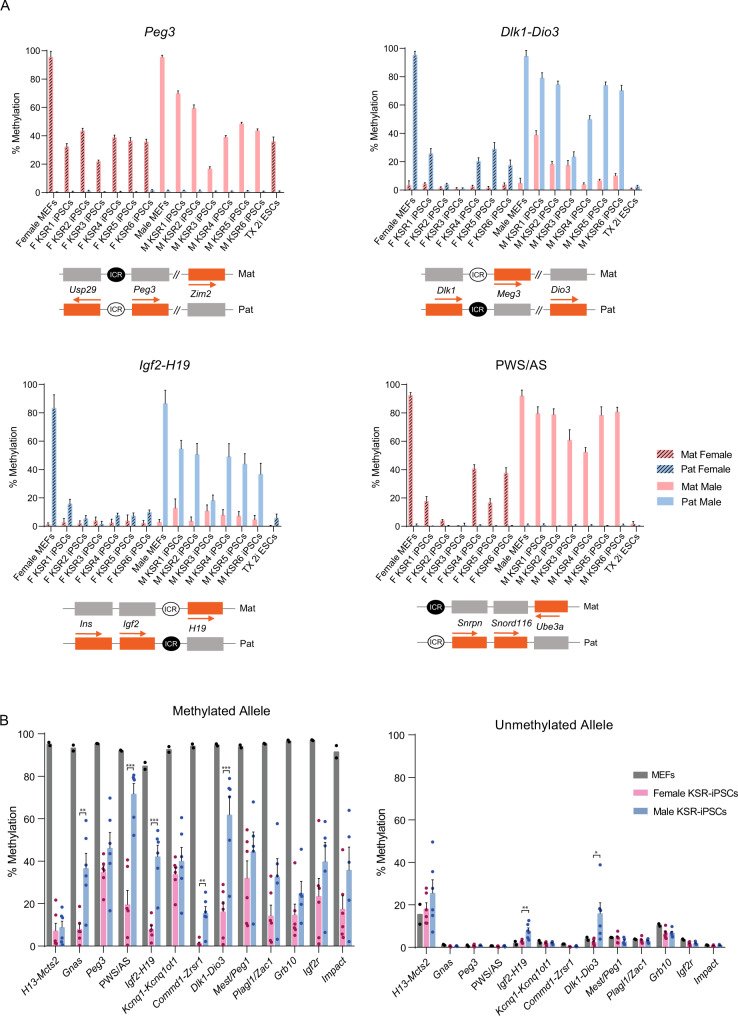
Fig. 2. Hypomethylation defects in KSR-iPSCs.
A Methylation analysis of Peg3, Dlk1-Dio3, Igf2-H19 and PWS/AS ICRs in female and male MEFs, female (F KSR1-6) and male (M KSR1-6) iPSCs and TX 2i ESCs; Each graph represents the mean percentage ± SD methylation levels measured at each CpG within different genomic regions per parental allele for each sample (number of CpG per locus - Peg3: n = 24; Dlk1-Dio3: n = 27; Igf2-H19: n = 16; PWS/AS: n = 15); Scheme on the bottom of each graph represents the normal methylation status of each ICR in the correspondent regions (white circle – unmethylated ICR; black circle – methylated ICR; Mat – maternal allele; Pat – paternal allele; orange rectangles – expressed genes; grey rectangles – silenced genes; regions are not drawn to scale). Source data are provided as Supplementary Data 2. B Average percentage of methylation at methylated and unmethylated alleles of ICRs in parental MEFs (n = 2 biological independent cell lines), female and male KSR-iPSCs (n = 6 each biological independent cell lines); Graph represents the mean ± SEM methylation levels measured at each CpG within different genomic regions per parental allele for each group of samples. Statistically significant differences between female and male KSR-iPSCs are indicated as * p < 0.05; ** p < 0.01; *** p < 0.001 (unpaired two-tailed Student’s t-test). Source data are provided as Supplementary Data 2.

