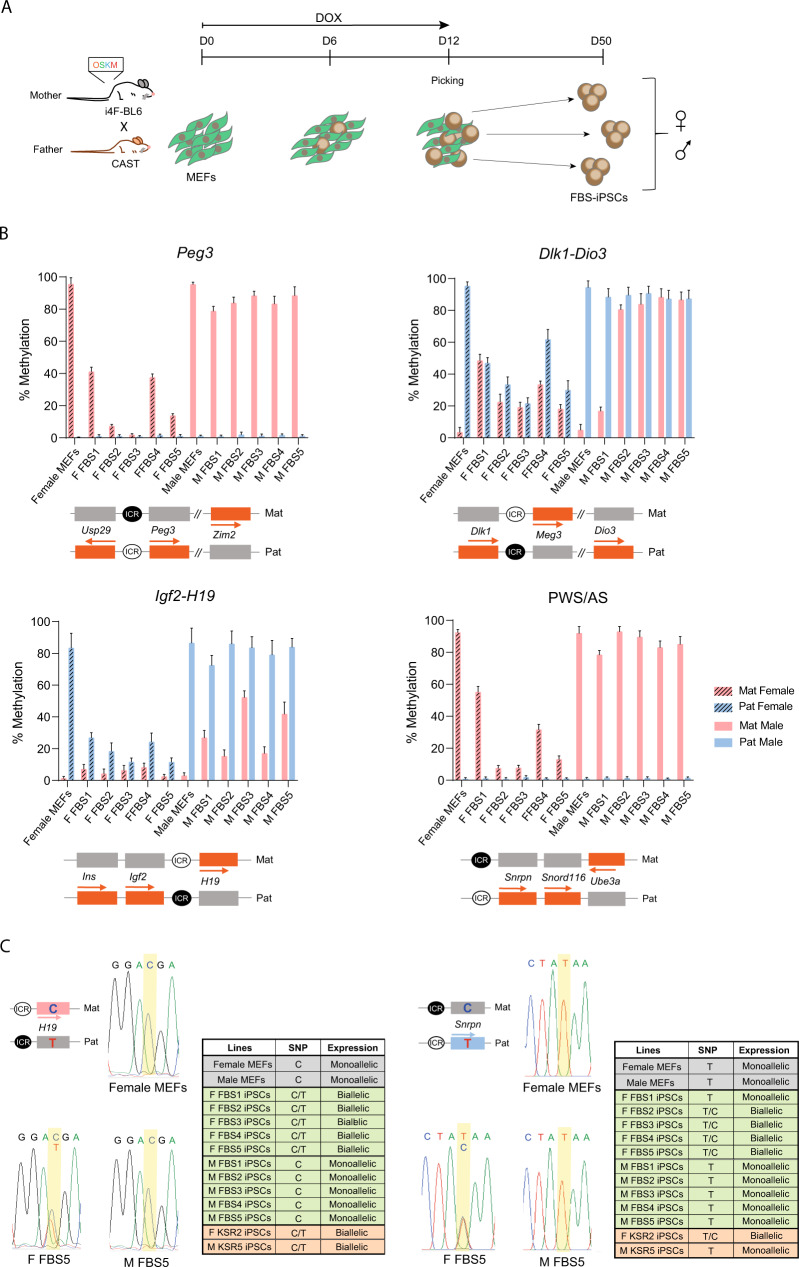
Fig. 4. Imprinting methylation defects in FBS-iPSCs.
A Schematic representation of the reprogramming protocol; briefly, a transgenic “reprogrammable” female mouse on a C57BL/6J genetic background (i4F-BL6) was crossed with a Mus musculus castaneus (CAST) male mouse to generate E13.5 F1 hybrid embryos from which mouse embryonic fibroblasts (MEFs) were collected. MEFs were reprogrammed by induction of the polycistronic Yamanaka cassette (Oct4/Sox2/Klf4/c-Myc - OSKM) in the presence of doxycycline (DOX) for 12 days. Individual mouse induced pluripotent stem cells reprogrammed in Foetal Bovine Serum medium (FBS-iPSCs) clones were picked at day 12 and expanded until approximately day 50. B Methylation analysis of Peg3, Dlk1-Dio3, Igf2-H19 and PWS/AS ICRs in male and female MEFs (note: same data as in Fig. 2A for MEFs), female (F FBS1-5) and male (M FBS1-5) FBS-iPSCs; Each graph represents the mean percentage ± SD methylation levels measured at each CpG within different genomic regions per parental allele for each sample (number of CpG per locus - Peg3: n = 24; Dlk1-Dio3: n = 27; Igf2-H19: n = 16; PWS/AS: n = 15); Scheme on the bottom of each graph represents the normal methylation status of each ICR in the correspondent regions (white circle – unmethylated ICR; black circle – methylated ICR; Mat – maternal allele; Pat – paternal allele; orange rectangles – expressed genes; grey rectangles – silenced genes; regions are not drawn to scale. Source data are provided as Supplementary Data 2. C Allelic expression of H19 and Snrpn genes assayed by RT-PCR followed by Sanger sequencing. Chromatograms are shown for female MEFs, F FBS5 and M FBS5 iPSCs; Table summarises the allele-specific expression for all the FBS-iPSCs as well as female and male MEFs, F KSR2 and M KSR3 iPSCs. Schemes on the left of the female MEFs chromatograms represent the normal imprinting profile of both H19 and Snrpn and the associated single nucleotide polymorphism (SNP) for each allele (white circle – unmethylated ICR; black circle – methylated ICR; Mat – maternal allele; Pat – paternal allele; pink rectangle – maternally H19 expressed gene; blue rectangle – paternally Snrpn expressed gene; grey rectangles – silenced genes; regions are not drawn to scale).

