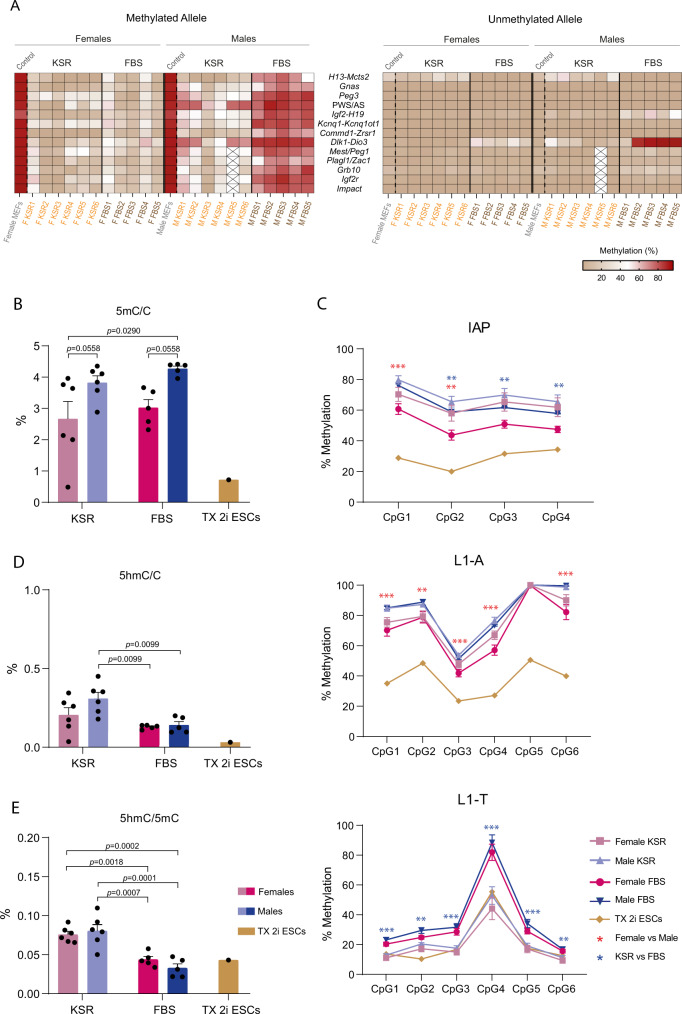
Fig. 5. Imprinting defects and global methylation changes in female and male KSR-/FBS-derived iPSCs.
A Heatmap representing the percentage of DNA methylation at the methylated (left) and unmethylated (right) alleles of ICRs for female and male MEFs (control) as well as female and male KSR- and FBS-iPSCs; ICRs are shown in rows and samples in columns; boxes with a cross indicate that Mest/Peg1, Plagl1/Zac1, Grb10, Igf2r and Impact imprinted regions were not assessed for M KSR5 iPSC line. Source data are provided as Supplementary Data 2. B Global 5mC levels measured by Liquid Chromatography with tandem mass spectrometry (LC-MS/MS). Graph represents the average percentage ± SEM of 5mC per total cytosines in female and male KSR- and FBS-iPSCs (n = 6 and n = 5 biologically independent cell lines, respectively), as well as in TX 2i ESCs (n = 1); The p-values (p) comparing female and male KSR- and FBS-iPSCs are indicated on the top of the bars (two-way ANOVA followed by multiple comparisons corrected by the original FDR method of Benjamini and Hochberg). Source data are provided as a Source Data file. C Percentage CpG methylation measured by bisulfite pyrosequencing for IAP, L1-A and L1-T repetitive elements. Graph represents the average methylation percentages ± SEM at each CpG sampled per repetitive element in female and male KSR-iPSCs (n = 4 and n = 5 biological independent cell lines, respectively) and female and male FBS-iPSCs (n = 5 biological independent cell lines each) as well as methylation percentages in TX 2i ESCs (n = 1). Statistically significant differences are indicated as ** p < 0.01; *** p < 0.001 (two-way ANOVA followed by Turkey’s multiple comparisons test) with red asterisks meaning statistically significant differences between sex (female vs male) and blue meaning statistically significant differences between medium formulation (KSR vs FBS). Source data are provided as a Source Data file. D Global 5hmC levels measured by LC-MS. Graph represents the average percentage ± SEM of 5hmC per total cytosines in female and male KSR- and FBS-iPSCs (n = 6 and n = 5, biologically independent cell lines each, respectively), as well as in TX 2i ESCs (n = 1); The p-values (p) comparing female and male KSR- and FBS-iPSCs are indicated on the top of the bars (two-way ANOVA followed by multiple comparisons corrected by the original FDR method of Benjamini and Hochberg). Source data are provided as a Source Data file. E Ratio of 5hmC/5mC levels measured by LC-MS. Graph represents the average percentage ± SEM of 5hmC per total 5mC in female and male KSR- and FBS-iPSCs (n = 6 and n = 5, biologically independent cell lines each, respectively), as well as in TX 2i ESCs (n = 1); The p-values (p) comparing female and male KSR- and FBS-iPSCs are indicated on the top of the bars (two-way ANOVA followed by multiple comparisons corrected by the original FDR method of Benjamini and Hochberg). Source data are provided as a Source Data file.

