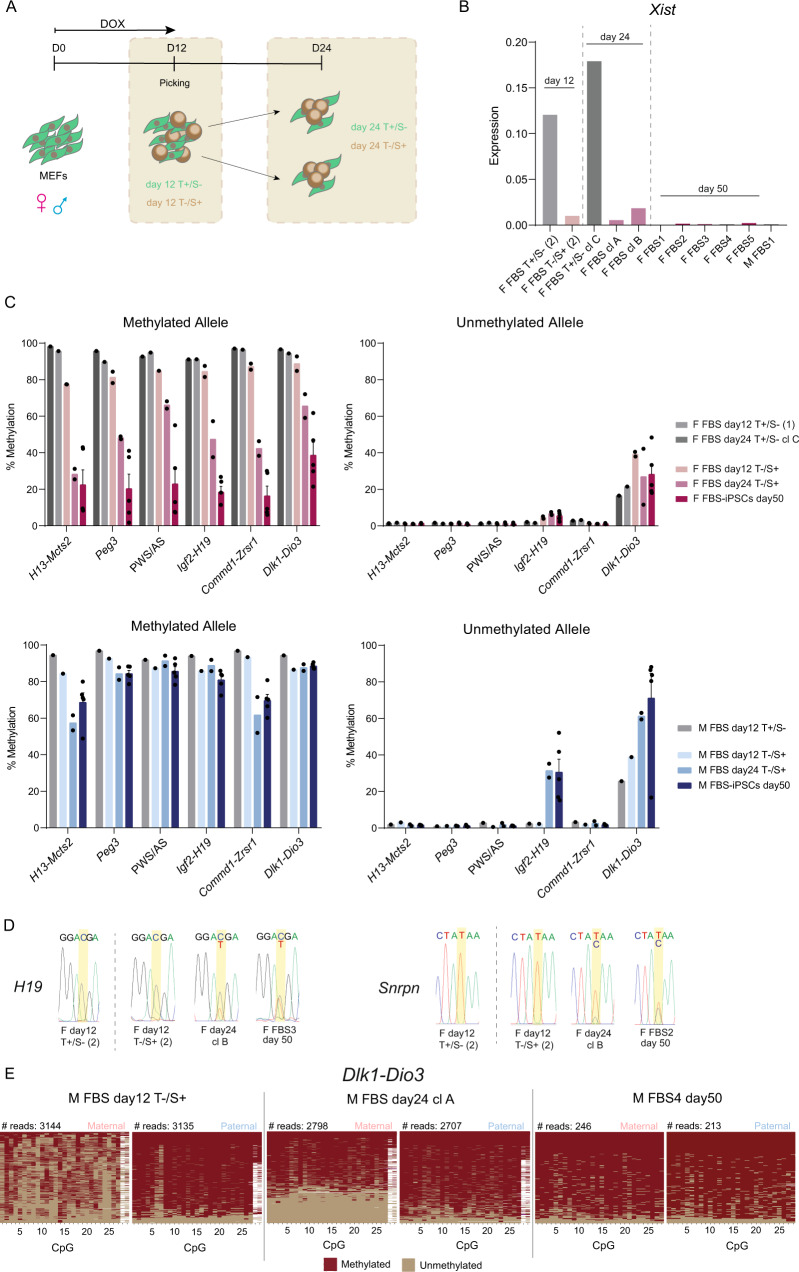
Fig. 6. Emergence of imprinting defects in male and female FBS-iPSCs during reprogramming.
A Schematic representation of the time-points for collection of reprogramming intermediates; briefly, F1 hybrid mouse embryonic fibroblasts (MEFs) containing the Yamanaka cassette were reprogrammed in Foetal Bovine Serum medium (FBS) in the presence of doxycycline (DOX) for 12 days. THY1-/SSEA1+ (T−/S+) reprogramming intermediates and THY1+/SSEA1- (T+/S-) non-reprogramming intermediates were FACS sorted at day 12 and day 24. In the case of iPSC clones already free of MEFs at day 24, iPSCs were harvested with no need for cell sorting (see Methods). B RT-qPCR expression analysis of Xist expression normalised with the Gapdh housekeeping gene in female cells collected during reprogramming (day 12, 24 and 50); each bar represents data from only one biological replicate. T+/S- non-reprogramming intermediates; T−/S+ reprogramming intermediates. Source data are provided as a Source Data file. C Average percentage of methylation at methylated and unmethylated alleles of ICRs in female and male cells sorted/collected at day 12 (T+/S−, n = 1 for both biological sexes; female T−/S+ , n = 2; male T−/S+ , n = 1) and at day 24 (female T+/S-, n = 1; T−/S+ , n = 2 for both biological sexes), as well day 50 fully reprogrammed iPSCs (note: same data as in Supplementary Fig. 4E for FBS-iPSCs day 50, n = 5 for both biological sexes); Graph represents the mean ± SEM methylation levels measured at each CpG within different genomic regions per parental allele for each group of samples; Source data are provided as Supplementary Data 2. D Allelic expression levels of H19 and Snrpn assayed by RT-PCR followed by Sanger sequencing during female reprogramming. Chromatograms of H19 gene are shown for F day12 T+/S- (2), F day12 T−/S+ (2), F day24 cl B as well as for fully reprogrammed F FBS3 collected at day 50. Chromatograms for Snrpn gene are shown for F day12 T+/S- (2), F day12 T−/S+ (2), F day24 cl B as well as for F FBS2 collected at day 50. E. Plots display methylated and unmethylated CpGs for each CpG position (in columns) in all the individual reads (in rows) for both maternal and paternal alleles of Dlk1-Dio3 imprinted locus in the reprogramming intermediates, M FBS day 12 T−/S+ and M FBS day 24 clone A, as well as in fully reprogrammed M FBS4 iPSCs collected at day 50.

