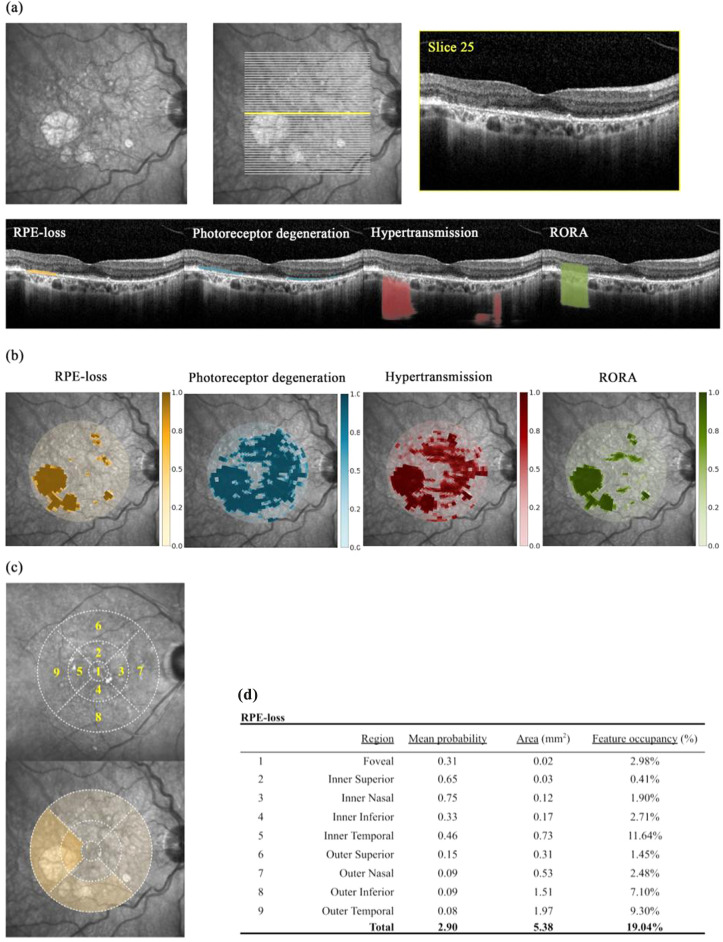
Figure 1.
Image analysis workflow. (a) For each OCT volume, all b-scans were segmented for RPE-loss (orange), photoreceptor degeneration (blue), hypertransmission (red), and RPE and outer retinal atrophy (RORA; green). RORA is taken to be overlapping regions of the three former features i.e. co-occurrence as per a-scan. Exemplar segmentation of a single b-scan and its axis along en face fundus photograph. (b) Resultant feature probability maps from total volume segmentations collectively presented by projection onto en face fundus photograph. Colour legends represent target feature probability. Manual central foveal point annotation permitted interpolation of a given voxel’s localisation in relation to the fovea. (c) ETDRS regions were also considered wherein the macula is considered as a 6 mm diameter circle divided into 9 areas: central foveal area (1 mm diameter); 4 parafoveal (collectively span 3 mm diameter); and 4 perifoveal areas. (d) Here, the mean feature probability within each region is displayed.

