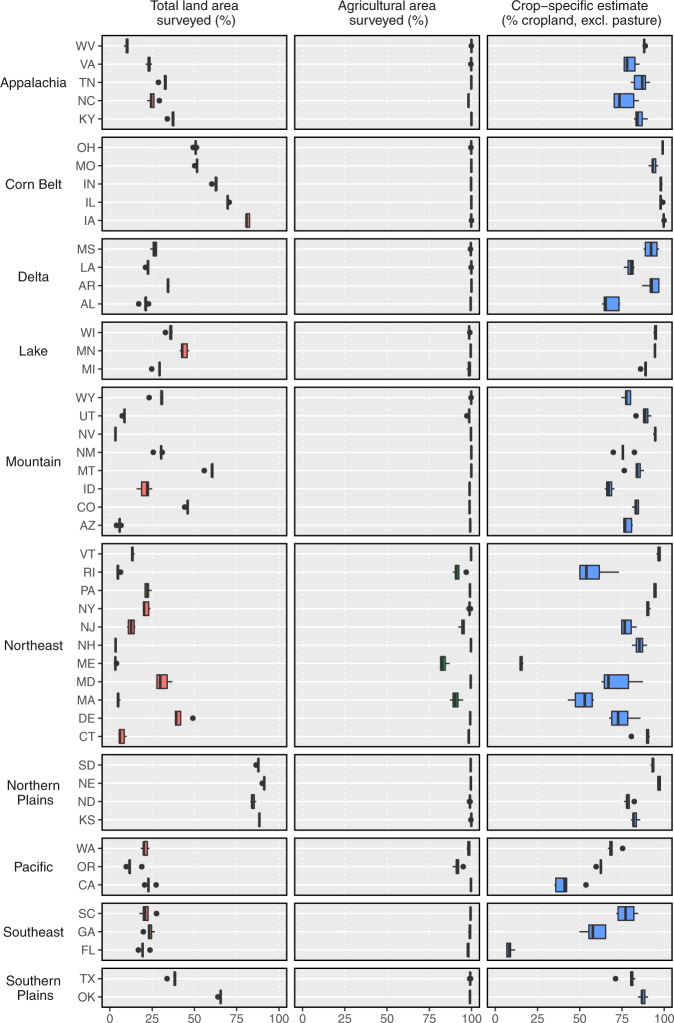
Fig. 4.
Pesticide survey coverage for the 48 contiguous states in even years from 2008–2016. (left) Percent of total land area represented by surveyed land uses, (center) percent of cropland represented by surveyed land uses (where ‘surveyed’ means included in the underlying pesticide use survey), and (right) percent of cropland (excluding pasture/hay) represented by a crop-specific estimate in the underlying pesticide use survey (crop-specific categories included corn, cotton, soybeans, alfalfa, wheat, and rice).

