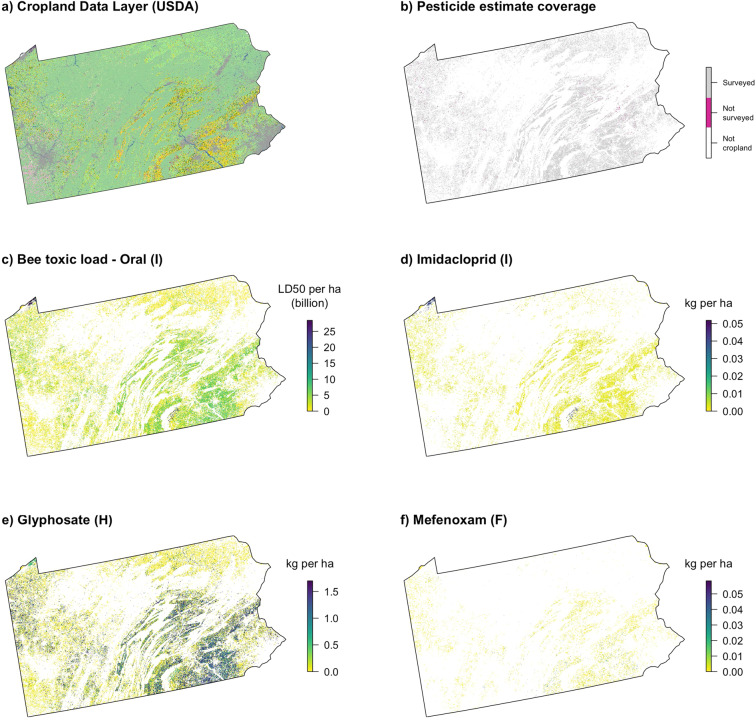
Fig. 5.
Maps illustrating the conversion of land cover to predicted landscape loading of agricultural pesticide use. Maps are shown for Pennsylvania in 2012 representing (a) input raster from the Cropland Data Layer, and output rasters illustrating (b) coverage in the underlying pesticide dataset, (c) bee toxic load for all insecticides combined on an oral-toxicity basis, (d) the insecticide imidacloprid, (e) the herbicide glyphosate, and (f) the fungicide mefenoxam. Resolution of maps was reduced for plotting.

