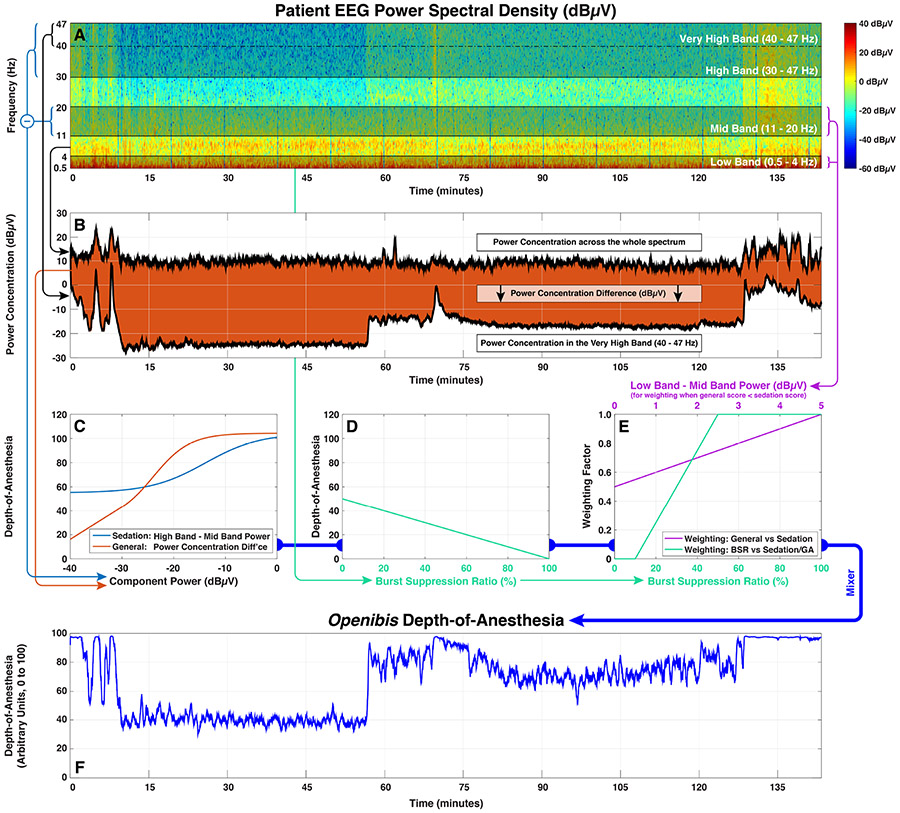
Figure 3:
A graphical roadmap of EEG processing in the openibis algorithm, using data from patient 09 in Figure 1.
(A) EEG epochs are converted into a power spectral density by Fourier transform. Subsequent calculations depend upon the relative power distributions across the whole frequency range, and across sub-bands spanning 0.5 – 4 Hz (low), 11 – 20 Hz (mid), 30 – 47 Hz (high) and 40 – 47 Hz (very high).
(B) A component related to general anesthesia is derived from the difference in power concentration between the very high band and the spectrum as a whole.
(C) The components related to sedation and general anesthesia are converted into depth-of-anesthesia scores using curvilinear logistic response functions.
(D) The burst suppression rate (BSR) is converted linearly into a depth-of-anesthesia score.
(E) The lower value of the sedation and general anesthesia scores predominates. Some transitional averaging between sedation and general occurs if the general score is lower and the difference between the low and mid band power is equivocal (≤ 5 dBμV). This score, representing the combination of sedation and general, is then weighted against the BSR score to produce a provisional final score.
(F) Extreme values in the provisional score (≤ 10 or ≥ 97) are compressed into the allowable range of 0 – 100 to produce the final score.

