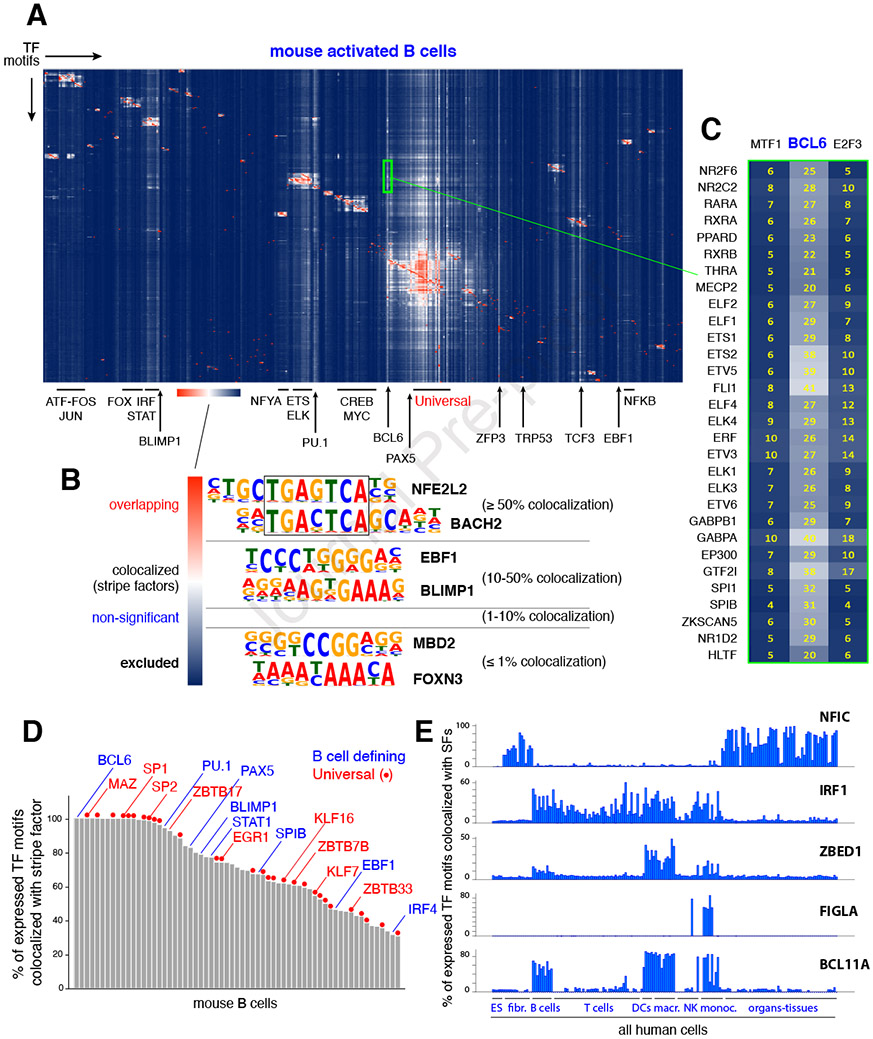
Figure 2. TF combinatorial information.

(A) Agglomerative hierarchical clustering showing the frequency of colocalization for all known TF pairs in mouse B cells. Family clusters are highlighted with bars while stripe factors are denoted with arrows. The color scale shown at the bottom illustrates the relative colocalization between functional motif pairs: red represents ≥ 50%; white represents 10-50%; blue represents non-significant to excluded (≤ 1%). (B) Hierarchical clustering identifies 4 main TF motif pair groups: overlapping (≥ 50% colocalization), colocalized (10-50%, stripe factors being a special case), non-significant, and excluded (≤ 1% colocalization). (C) Close up view of the BCL6 stripe (green rectangle in panel A). As an example, 25% of all elements containing the NR2F6 TF motif (top in the list) also contain the BCL6 motif. (D) Bar graph showing all 63 mouse B cell stripe factors classified based on the percentage of expressed TFs that are colocalized with them. Examples of B cell-defining factors (blue) and universal stripe factors (red) are shown. (E) Examples of TFs that display stripe profiles in defined cell types.
