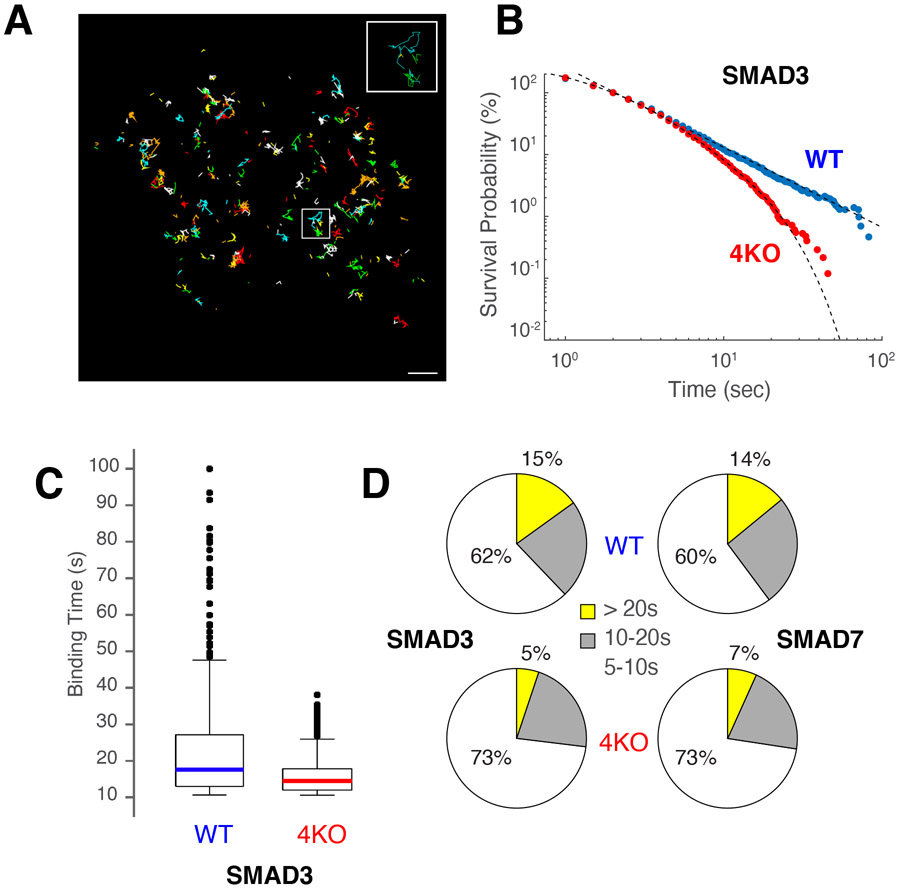
Figure 7. Lack of USF recruitment impacts residence time of colocalized factors.
(A) Micrograph showing particle trajectories of HALO-SMAD3 in WT CH12 B cells. Colors represent different tracks. Bar = 1 μm. (B) Survival probability (%) of HALO-SMAD3 molecules in WT (blue) or 4KO (red) CH12 B cells. The data was fitted to power-law or biexponential curves respectively. (C) Box plot showing binding time distribution (in seconds) of HALO-SMAD3 molecules expressed in WT or 4KO cells. (D) Pie charts showing percentage of the different diffusive states of SMAD3 (left) or SMAD7 (right) displaying residence times of 5-10” (white), 10-20” (grey) or > 20” (yellow). Upper pie charts represent data from WT cells, lower from 4KO.

