
Fig. 1.
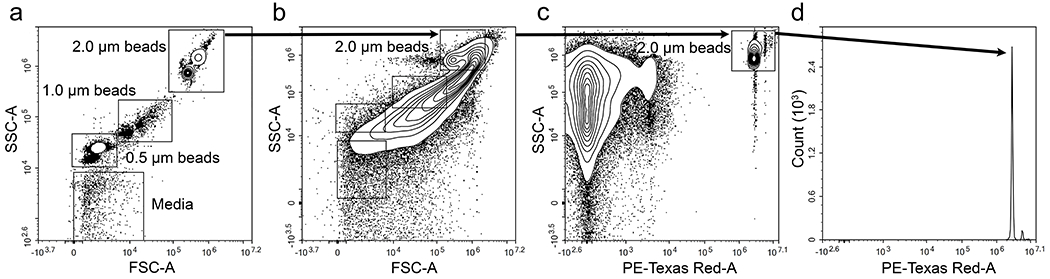
Quantification of fluorescent microspheres by flow cytometry. Gating was established using microspheres of different sizes for comparison (a). Microspheres were distinguished from cells and microparticles in forward scatter vs side scatter density plots (b) and side scatter vs fluorescence density plots (c). The number of microspheres analysed was obtained from the corresponding microspheres’ histogram gate in (c) as a reason of the fluorescent channel in (d)