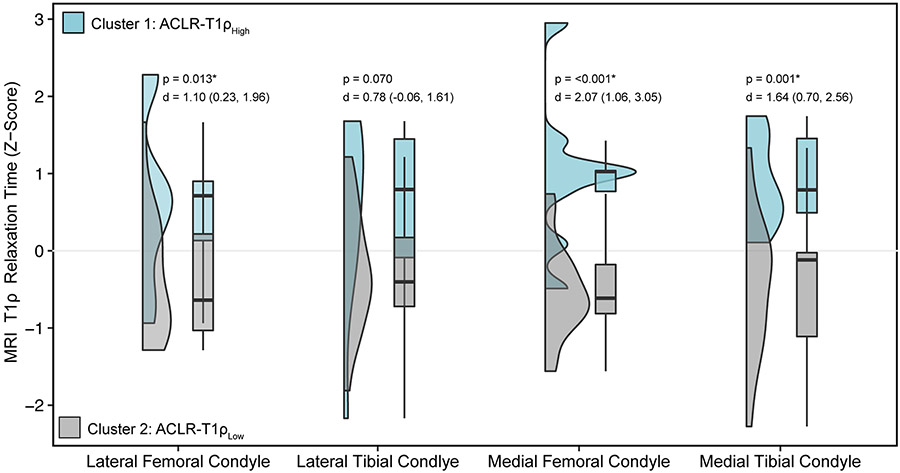
Figure 1. MRI T1ρ Relaxation Times of k-Means Clusters.
Figure 1 shows the distributions of lateral and medial femoral and tibial condyles z-scores for the ACLR-T1ρHigh and ACLR-T1ρLow groups using violin and box and whisker plots. Box and whisker plots display the minimum, first quartile, median, third quartile, and maximum z-scores. Associated p values and Cohen’s d effect sizes and associated 95% confidence intervals are provided above the plots for each comparison.

