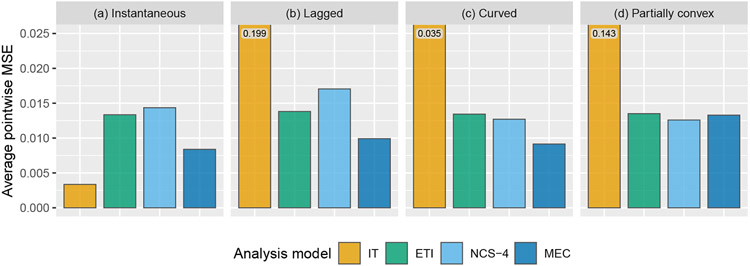
FIGURE 4.
Simulation results: average pointwise mean squared error for the estimation of the entire effect curve using the following four models: immediate treatment effect (IT), exposure time indicator (ETI), natural cubic spline with 4 degrees of freedom (NCS-4), monotone effect curve (MEC). Numeric values displayed over graph bars represent the height of the bars that are cut off because of the scale of the axes; see Table E2 for results in tabular form.

