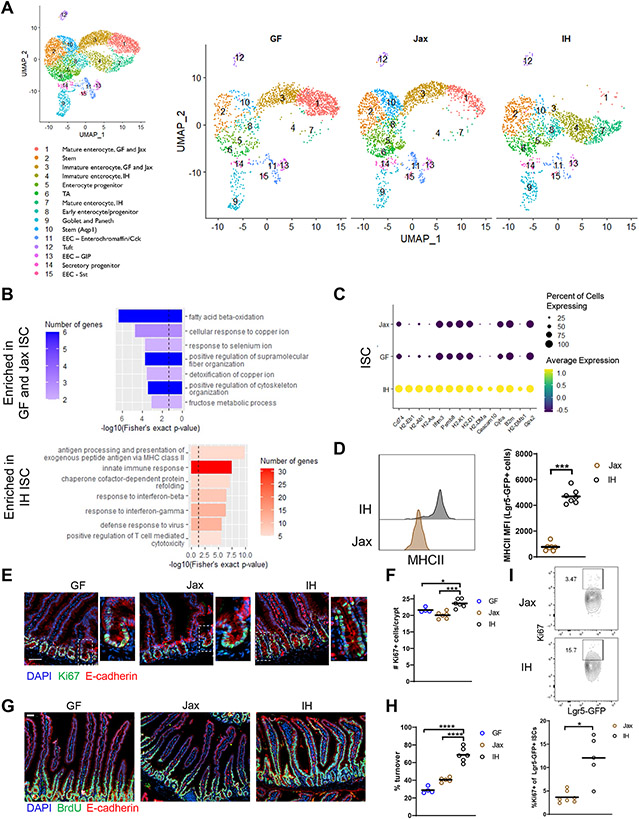
Figure 1. Certain microbiota features regulate intestinal stem cell proliferation and epithelial turnover.
(A) UMAP representation of scRNAseq of sorted live EpCAM+CD45−Ter119−CD31− IECs. n=1. TA, transit amplifying; EEC, enteroendocrine. (B) GO categories for DEGs enriched in IH vs GF and Jax ISCs (dashed line indicates p value = 0.05). (C) Top DEGs in IH vs GF and Jax ISCs ranked by significance. (D) MHCII expression in ISCs. (E) Representative images (higher magnification on right) (scale bar 50 μm) and (F) quantification of Ki67+ cells. (G) Representative images (scale bar 50 μm) and (H) quantification of epithelial turnover after 48h continuous BrdU labeling. (I) Representative plots and quantification of Ki67 expression in Lgr5-GFP ISCs. Each symbol (D, F, H, I) represents data from an individual mouse. Data are pooled from 2-3 experiments (D, F, H, I). Data are shown as mean with individual data points. *p < 0.05, **p < 0.01, ***p < 0.001, Mann-Whitney U test (D, I), one-way ANOVA with Holm-Sidak’s post-test (F, H). See also Figures S1, S2, Table S1.

