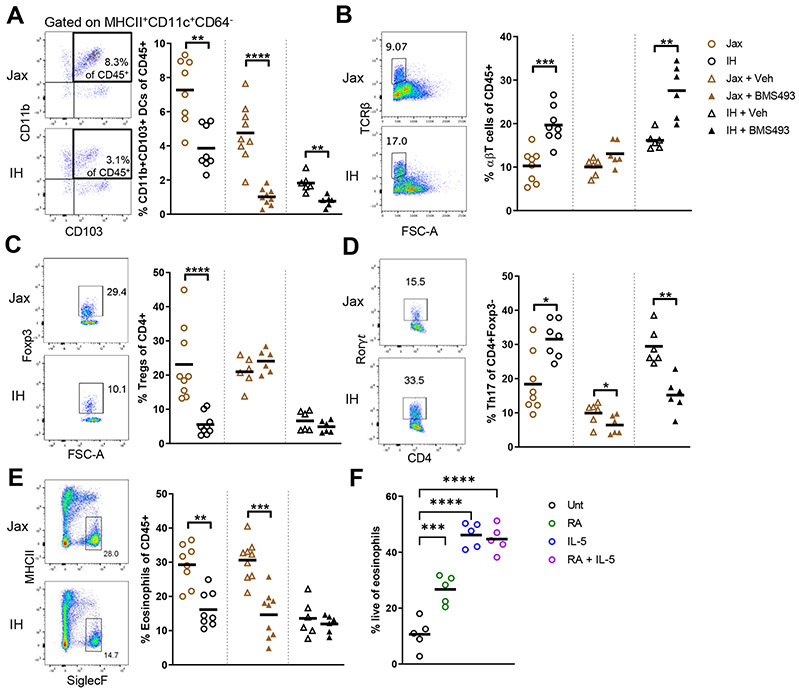
Figure 3. Differential epithelial cell production of retinoic acid in Jax and IH mice regulates intestinal immune populations.
(A-E) Flow cytometric profiling of lamina propria immune populations at steady state, or after treatment with 220μmg RAR inhibitor BMS493 or vehicle (DMSO) for 8 days. (F) Live eosinophils measured by flow cytometry after 24h culture of sorted bone marrow eosinophils with 10ng/mL IL-5, 100nM RA, or both.
Each symbol represents data from an individual mouse. Data reflect at least 2 independent experiments. Data are shown as mean with individual data points. *p < 0.05, **p < 0.01, ***p < 0.001, ****p < 0.0001, Mann-Whitney U test (A-E), one-way ANOVA with Holm-Sidak’s post-test (F). See also Figures S4, S5.

