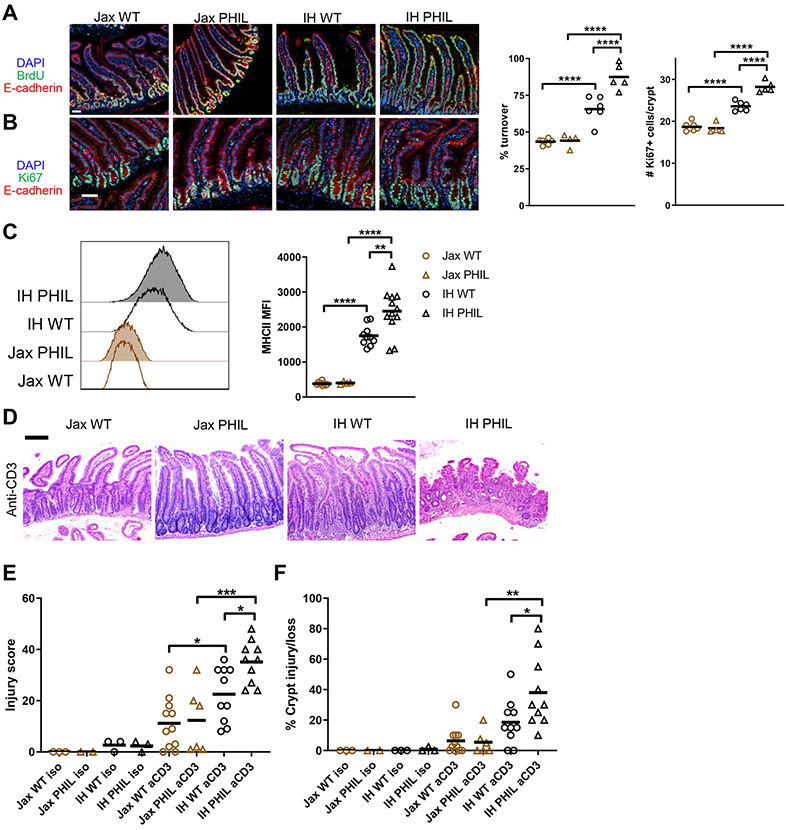
Figure 4. Eosinophils regulate epithelial cell turnover, MHCII expression, and response to injury.
Representative images (scale bar 50 μm) and quantification of (A) Epithelial turnover after 48h continuous BrdU labeling and (B) Ki67+ cells. (C) MHCII expression on epithelial cells. (D) Representative hematoxylin and eosin staining (scale bar 200 μM), (E) Histological injury score, and (F) Percent crypt injury/loss in duodenum on day 3 after injection of anti-CD3.
Each symbol represents data from an individual mouse. Data reflect at least 3 independent experiments. Data are shown as mean with individual data points. *p <= 0.05, **p < 0.01, ***p < 0.001, ****p < 0.0001, two-way ANOVA with Holm-Sidak’s post-test.

