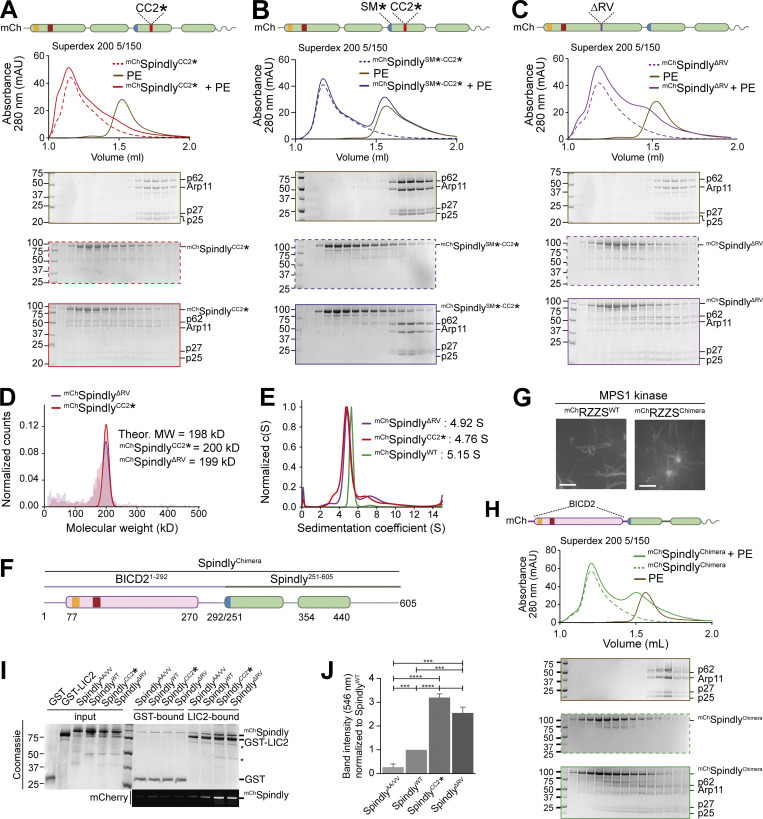
Figure 5.
Point mutations relieve Spindly autoinhibition. (A–C and H) Analytical SEC analyses on a Superdex 200 5/150 column to assess complex formation between the Dynactin PE (brown) and various Spindly constructs. The complex run is always represented with a continuous line, the Spindly construct with a dashed line. (A) mChSpindlyCC2* (red). (B) mChSpindlySM*-CC2* (blue). (C) mChSpindlyΔRV (purple). (H) mChSpindlyChimera (green). PE: 3 µM; Spindly construct: 8 µM. (D) Mass photometry results for mChSpindlyCC2* (red) and mChSpindlyΔRV (purple). The main peaks’ “shoulders” are consistent with minor sample degradation. (E) AUC profile of mChSpindlyCC2* (red), mChSpindly∆RV (purple), and mChSpindlyWT (green). c(S), sedimentation coefficient. (F) schematic representation of the mChSpindlyChimera. (G) Spinning-disk confocal fluorescence microscopy-based filamentation assay at 561 nm shows the indicated mChRZZSF species (4 µM RZZ, 8 µM farnesylated Spindly) form filaments when incubated at 20°C with MPS1 kinase. Scale bar: 5 µm. (I) SDS-PAGE analysis of pulldown assay with either GST or GST-tagged LIC2 as bait, and mCh-tagged Spindly as prey. Coomassie staining and fluorescent signal in the red channel are displayed. Asterisks mark contaminants or degradation products. (J) Quantification of the mChSpindly fluorescent signal and SDs calculated from three technical replicates. Statistical analysis was performed with a parametric test comparing two unpaired groups. ***, P ≤ 0.001; ****, P ≤ 0.0001. The PE alone controls in A and C are shared with the control in Fig. 3 E. mAU, milli absorbance units. Molecular weights are in kD. Source data are available for this figure: SourceData F5.

