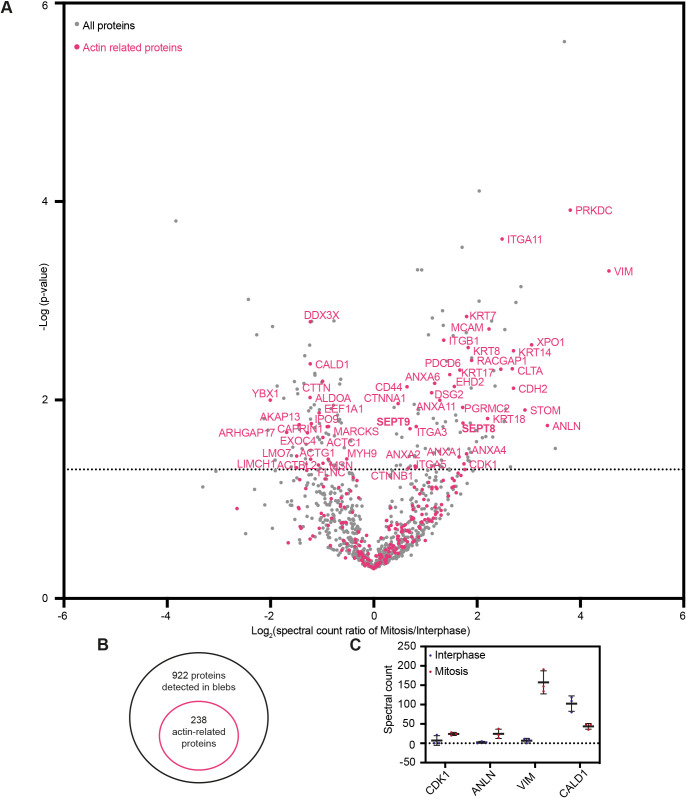
Fig. 3.
Changes in cortical levels of actin-binding proteins between interphase and mitosis. (A) Volcano plot of the 922 selected proteins detected in blebs, showing the enrichment (x-axis) and the significance of this enrichment (P-values, y-axis) between interphase and mitosis. Dotted line highlights −log10 (P-value)=1.3, corresponding to P-value=0.05; three independent replicates; statistics unpaired one-tailed Student's t-test. Bright pink dots: actin-related proteins. (B) Schematic of actin-related proteins among all proteins detected in blebs. (C) Spectral counts in the mass spectrometry analysis of mitotic and interphase blebs for proteins known to change in levels at the cortex between interphase and mitosis. Each data point corresponds to an individual replicate, with mean±s.d. shown. Spectral counts were normalised to account for variation between experiments.

