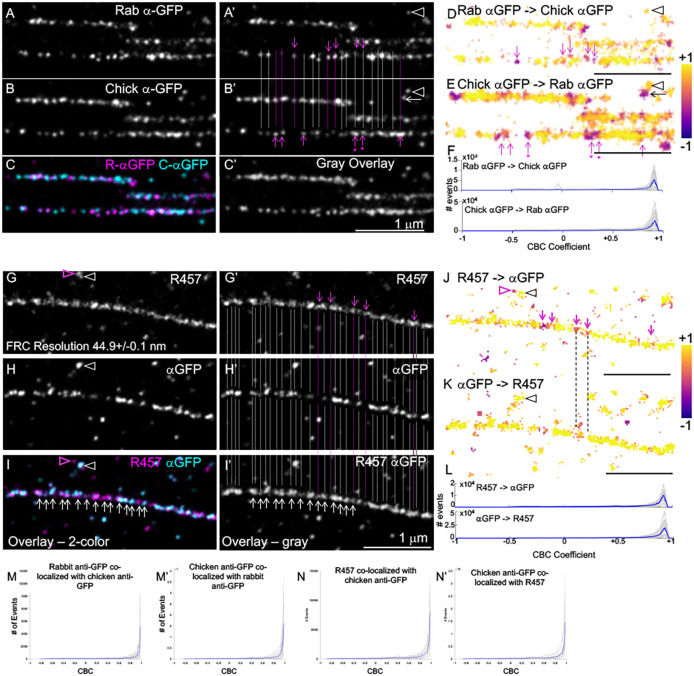
Fig. 7.
Double-color dSTORM shows that N- and C-termini of Fn1 overlap within Fn1 nanodomains. (A–C) Fn1 fibrils were detected in Fn1mEGFP/mEGFP cells plated on glass coverslips without coating using polyclonal rabbit and chicken anti-GFP antibodies. A′,B′ show the same images as in A,B with gray and pink lines marking overlapping and non-overlapping nanodomains, respectively. Pink dots under the pink arrows indicate nanodomains in which the signal in one channel is higher than in the other. C and C′ show the merged signals in color and grayscale, respectively. <100% overlap is expected as ELE<100%. (D,E) Co-distribution of localizations in one channel with those in another channel (e.g. Rab αGFP with chick αGFP in D) is color-coded according to the coordinate-based co-localization (CBC) coefficient; (Rmax=300, r=30). +1 indicates complete overlap; 0 indicates no overlap. Pink arrows in D,E correspond to those in A′,B′. Arrowheads in A′,B′,D,E indicate overlapping signals, and the arrow next to the arrowhead in B′ and E indicates adjacent non-overlapping signals. (F) CBC coefficients for 22 regions containing long fibrils (gray traces) and their average (blue trace). (G–I) Fn1 fibrils were detected in Fn1mEGFP/mEGFP cells plated on glass coverslips without coating using rabbit polyclonal R457 antibody and chicken anti-GFP antibody. G′–I′ show the same images as in G–I with overlapping (gray lines) and non-overlapping (pink lines and arrows) staining. I and I′ show the merged signals in color and grayscale, respectively. White arrows in I,I′ point to nanodomains. (J,K) Co-distribution of localizations in one channel with those in another channel (e.g. R457 with chick αGFP) is color-coded according to the CBC coefficient; (Rmax=300, r=30). Pink arrows shown in J correspond to those in G′. Pink arrowheads in G correspond to pink arrowheads in I and J, and point to non-overlapping nanodomains. White arrowheads in G, H correspond to black arrowheads in J, K and point to overlapping nanodomains. Note that settings for CBC analysis distinguish overlapping and non-overlapping localizations in adjacent nanodomains. (L) CBC coefficients for 20 long fibrils (gray traces) and their average (blue trace). (M,M′,N,N′) CBC using ThunderSTORM (Rmax=50 nm, r=5 nm) for 22 fibrils, four cells (M,M′) and 17 fibrils, four cells (N,N′). Images are representative of fibrils in six cells. Scale bars: 1 μm.

