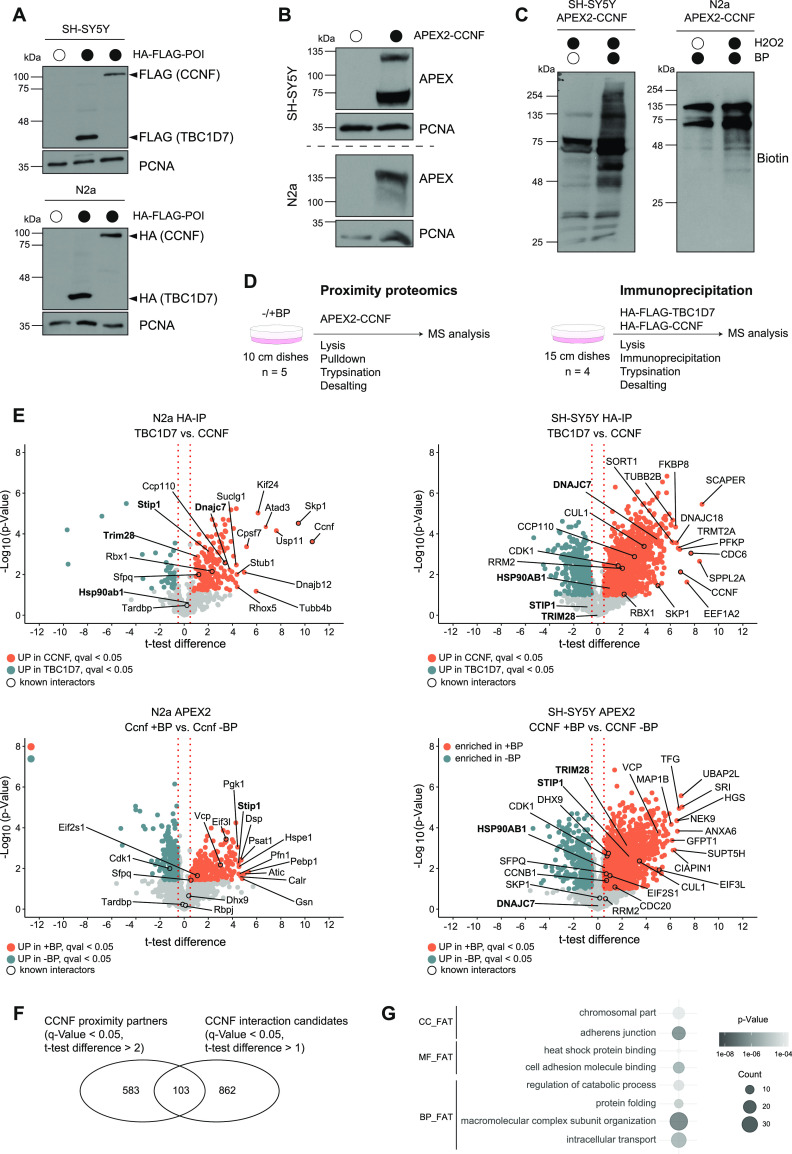
Figure 2. Cyclin-F proximity and interaction proteomics.
(A, B) Lysates from empty and HA-FLAG-CCNF or -TBC1D7 (A) and APEX2-CCNF (B) overexpressing SH-SY5Y and N2a cells were analyzed by SDS–PAGE and immunoblotting. (C) Biotinlyation in SH-SY5Y and N2a cells overexpressing APEX2-CCNF was induced by 30 min biotin-phenol (BP) and 1 min H2O2 treatment followed by lysis and immunoblot analysis. (D) Schematic overview of proximity and interaction proteomics workflow. (E) Volcano plots showing changes in abundance of candidate interacting proteins of HA-FLAG-TBC1D7 (control) and HA-FLAG-CCNF in N2a and SH-SY5Y (upper panel) and of proximity partners of APEX2-CCNF in the absence (control) and presence of BP in N2a and SH-SY5Y (lower panel). Proteins enriched in HA-FLAG-CCNF immune complexes or in proximity to APEX2-CCNF are shown in orange (t test difference > 0.5, q-value < 0.05, FDR-corrected, t test). Top 10 significantly enriched proteins, known CCNF interactors (black circles) and selected candidates are highlighted. (F) Overlap between proximity partners (q-value < 0.05, t test difference > 2, t test) and interaction candidates (q-value < 0.05, t test difference > 1, t test). (E, G) Gene Ontology (GO) analysis of proteins found in the overlap of (E). Grey gradient represents P-values. The number of proteins (count) found associated with a given GO term is indicated by the size of the circles. BP, biological process; CC, cellular component; MF, molecular function.

