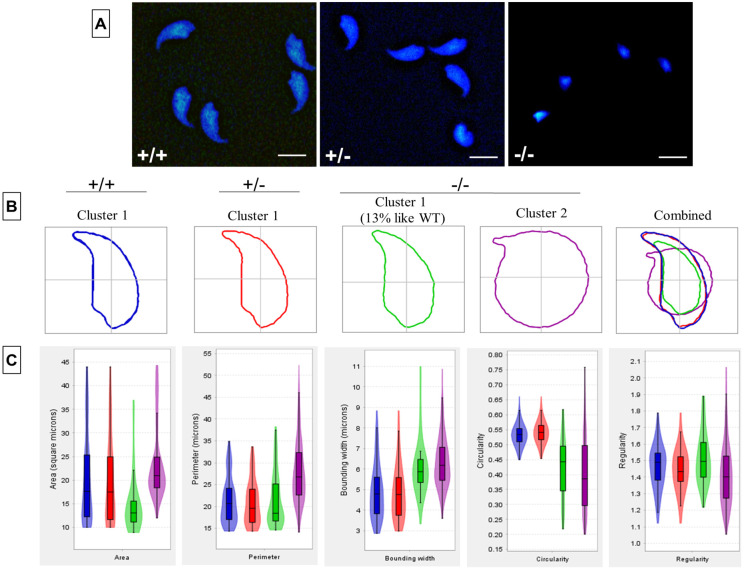
Fig. 2.
Sperm head morphology analysis. Sperm head morphology analysis on WT, Pfn4+/− and Pfn4−/− sperm cells (n=3 biological replicates/genotype). In total, 901 nuclei were analyzed: 309 for WT (cluster 1), 276 for Pfn4+/− (cluster 1) and 541 for Pfn4−/− (86 sperm nuclei in cluster 1 and 455 nuclei in cluster 2). (A) Sperm cells stained with DAPI. (B) Head morphology of WT, Pfn4+/− and Pfn4−/− sperm cells. (C) Area, perimeter, regularity, bounding width, and circularity of WT, Pfn4+/− and Pfn4−/− sperm cells. Bonferroni's corrected P-values were calculated using the non-parametric Mann–Whitney–Wilcoxon test. Error bars show the mean±s.d. Box boundaries indicate consensus nucleus (overall examination of the population). Horizontal lines indicate mean of the respective parameter and error bars indicate coefficient of variability, standard error and standard deviation per parameter.

