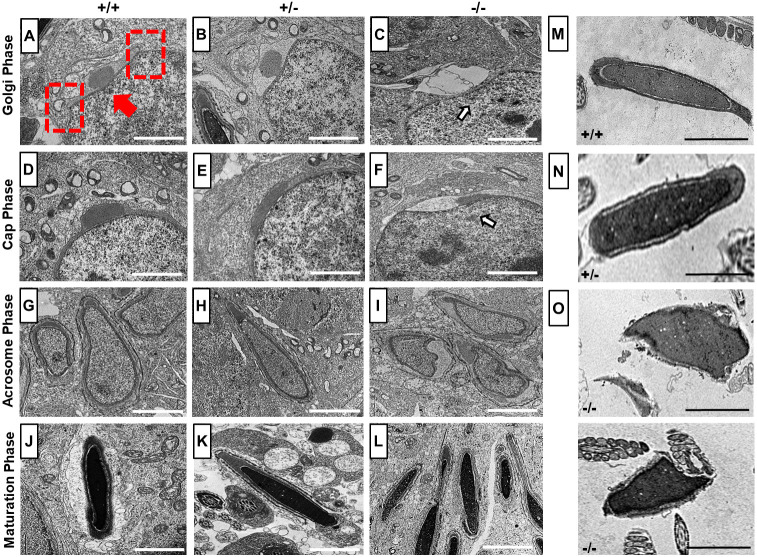
Fig. 6.
TEM analysis. (A-L) Ultrastructural analysis using TEM on testes sections of WT, Pfn4+/− and Pfn4−/− mice (n=3 biological replicates/genotype). (A-C) Golgi phase spermatozoa of WT (A), Pfn4+/− (B) Pfn4−/− (C) mice (arrow indicates deformed developing acrosome). Red arrow indicates the acroplaxome, red dashed rectangles indicate the marginal ring. (D-F) Cap phase spermatozoa of WT (D), Pfn4+/− (E) and Pfn4−/− (F) mice (arrow indicates abnormal cap-like structures). (G-I) Acrosomal phase spermatids of WT (G), Pfn4+/− (H) and Pfn4−/− (I) mice. (J-L) Maturation phase spermatids of WT (J), Pfn4+/− (K) and Pfn4−/− (L) mice. (M-O) Ultrastructural analysis of cauda epididymal sperms of WT (M), Pfn4+/− (N) and Pfn4−/− (O) mice. Scale bars: 2 μm.

