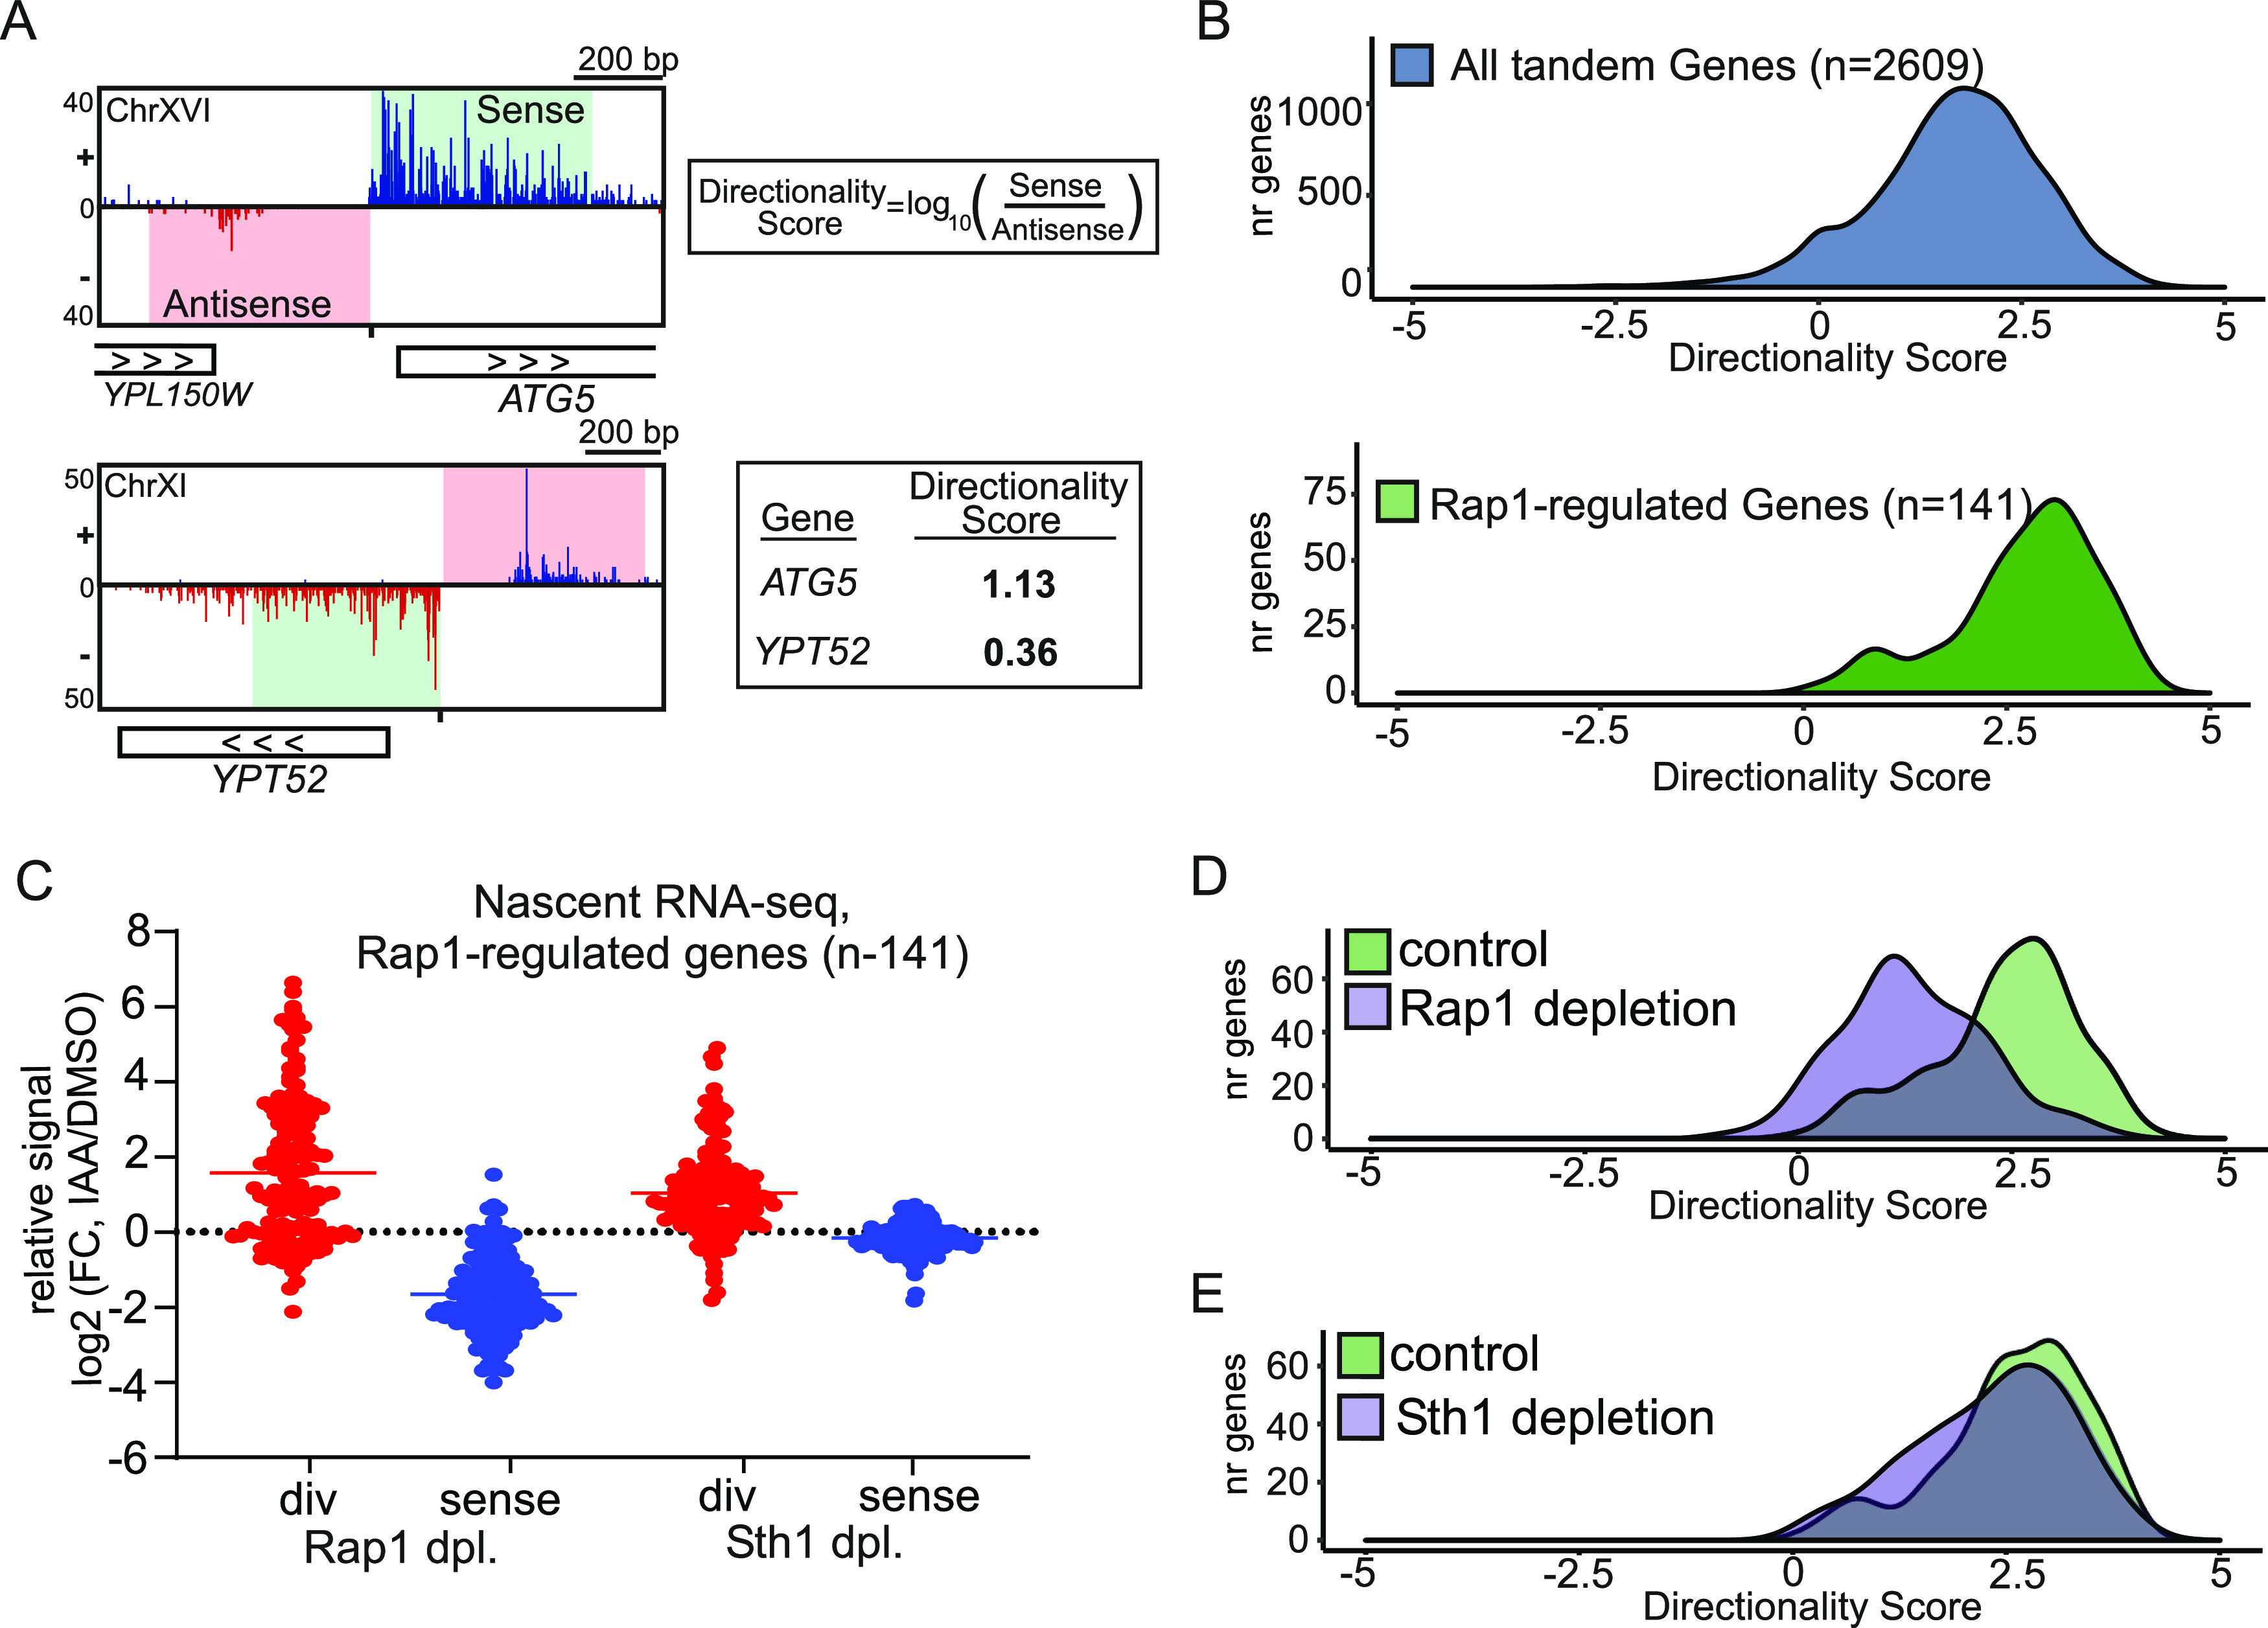
Figure 2. Depletion of RSC increases divergent transcription and alters promoter directionality.

(A) Approach for calculating directionality score for each promoter. In short, the nascent RNA-seq signals 500 bp upstream (antisense strand) and 500 bp downstream (sense strand) of the coding gene transcription start site were taken. Subsequently, the ratio of sense over antisense signals (log10) was computed, which was defined as the directionality score. Another approach was also described in Jin et al (2017). (B) Density plots of directionality scores for tandem non-overlapping genes (n = 2,609) and Rap1-regulated genes (n = 141). (C) Relative changes in divergent (red) or sense (blue) transcription levels in cells depleted (dpl) for Rap1 or Sth1 (RAP1-AID or STH1-AID) in comparison to the corresponding mock-treated cells (IAA/DMSO) for Rap1-regulated gene promoters (n = 141). The nascent RNA-seq signals in the regions upstream (500 bp on the antisense strand, red) and 500 bp downstream (sense strand, blue) of the transcription start site were quantified and compared. Each dot represents one gene, for which the average log2(FC) value between replicates is shown. (D) Density plot representing promoter directionality of control (RAP1-AID +DMSO) and Rap1-depleted cells (RAP1-AID + IAA) for Rap1-regulated genes (n = 141). Average values between biological replicates (n = 3) are shown. (E) Similar as (D), except comparing control (STH1-AID + DMSO) and Sth1-depleted (STH1-AID + IAA) cells.
