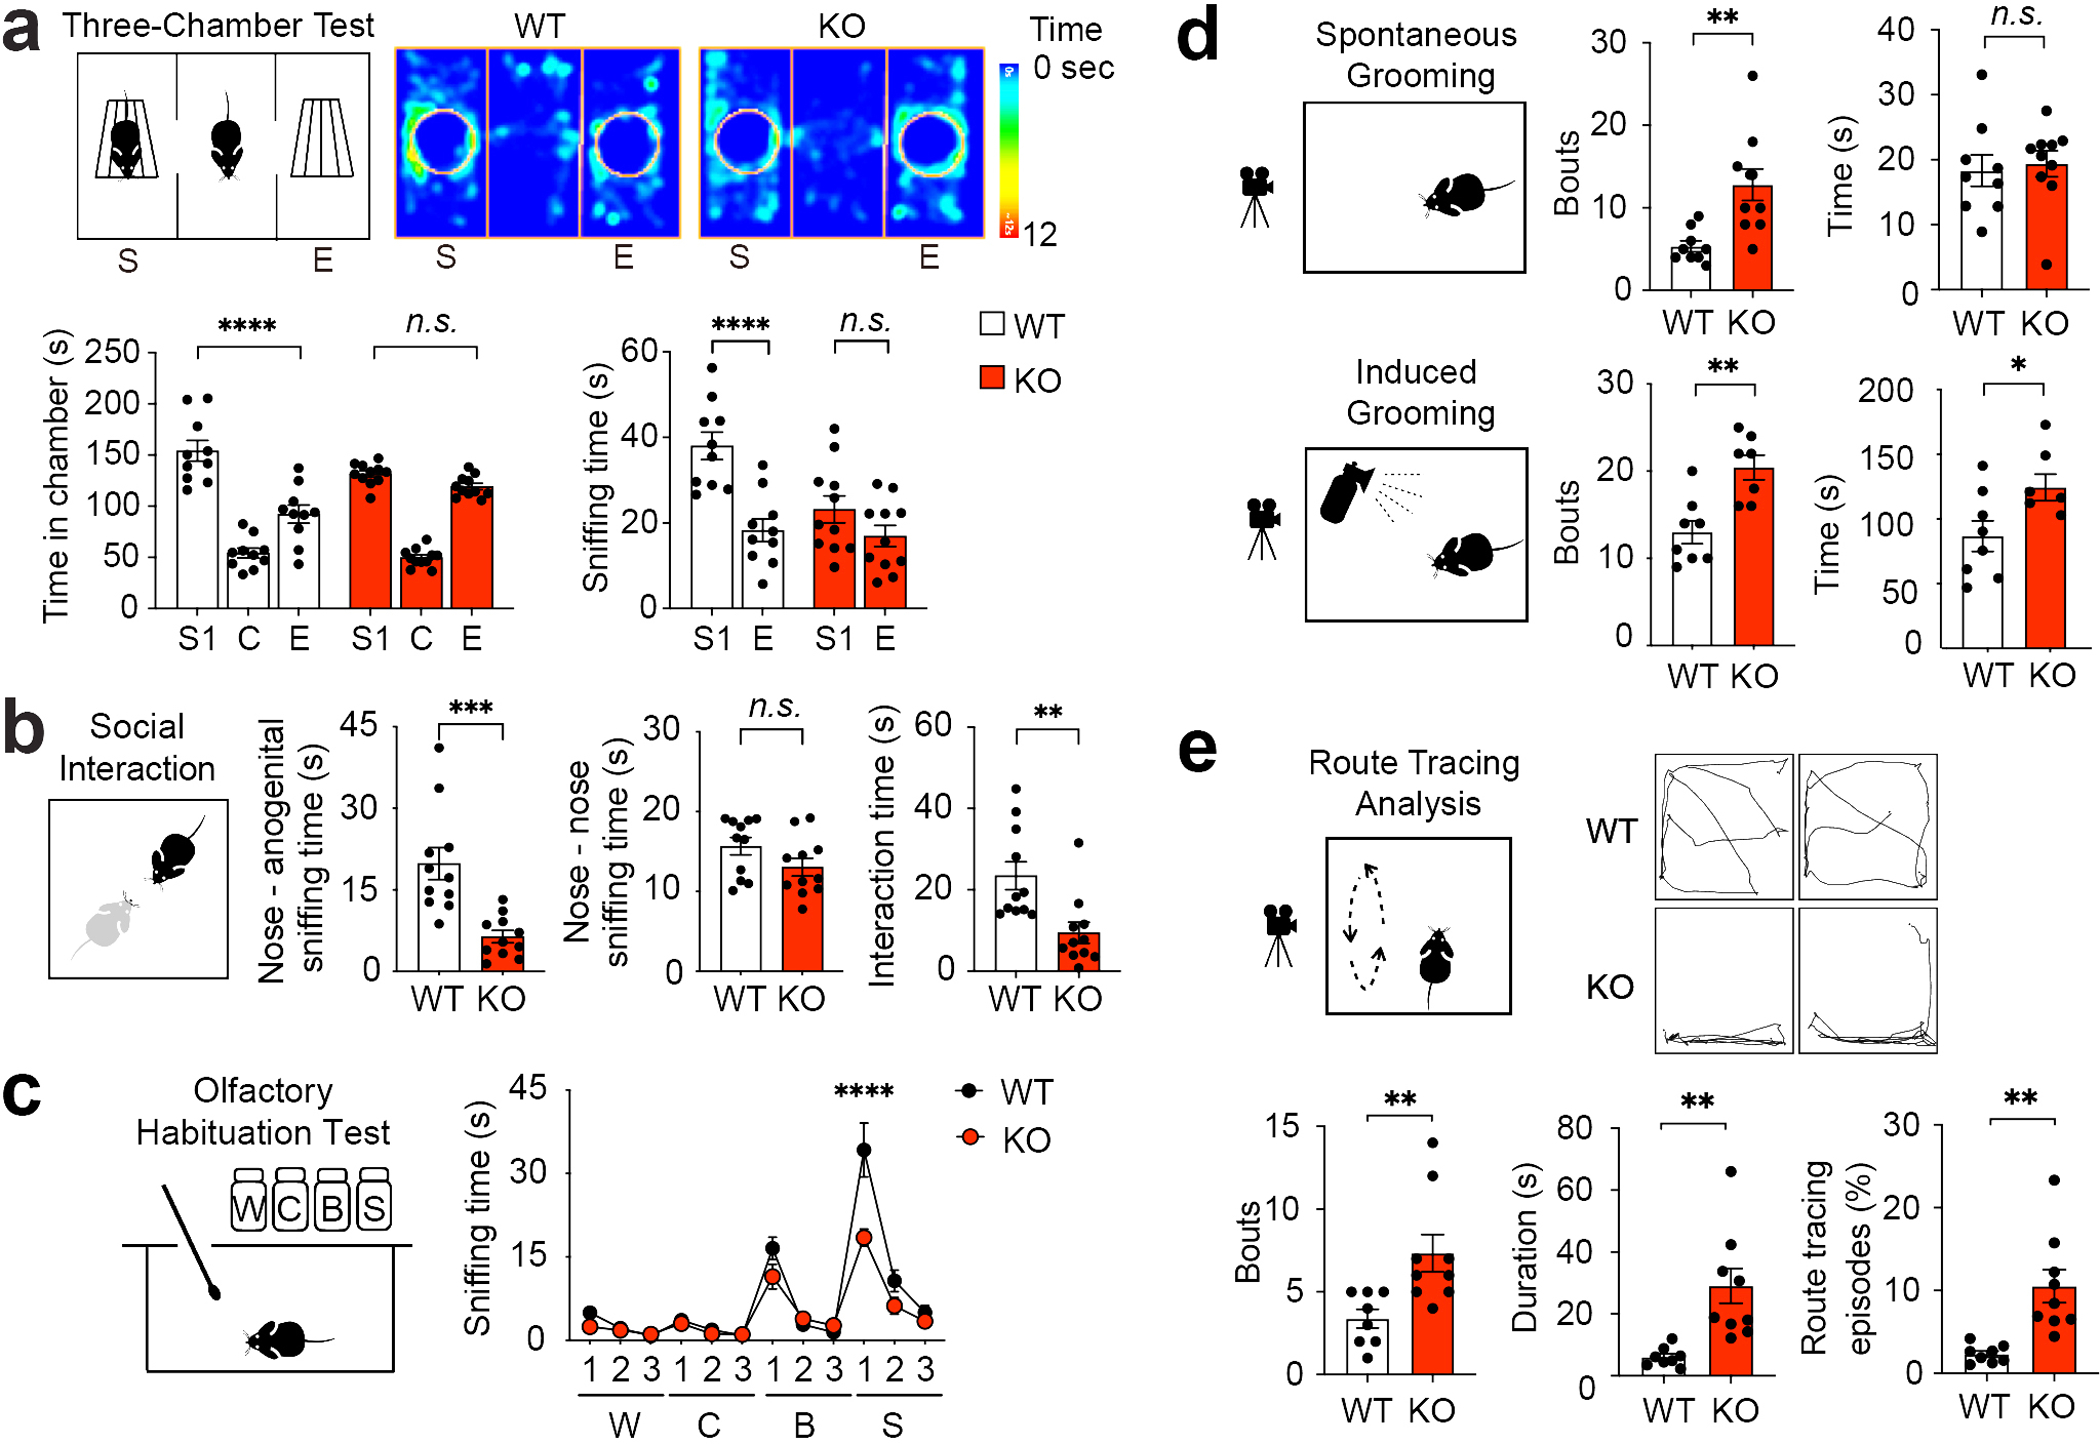
Figure 1. Bmal1 KO mice exhibit deficits in social interaction, excessive repetitive behaviors, and stereotypy.

(a) Three-chamber test for mouse sociability. Top: a schematic diagram and representative heat maps of a Bmal1 WT mouse and a Bmal1 KO mouse in the three-chamber test. S: stranger 1, C: center, E: empty. The heat map indicates time spent on the location. Bottom: bar graphs indicating time spent in individual chambers (left, F (2, 57) chamber × genotype = 8.735, P = 0.001, two-way ANOVA) and time spent sniffing wire cages (right, F (1, 38) chamber × genotype = 5.451, P = 0.025, two-way ANOVA) during the three-chamber test. Note that the KO mice spent similar time in the S chamber as in the E chamber (Bmal1 KO: S vs. E, P = 0.421, post hoc Bonferroni’s comparison). The KO mice also spent similar time sniffing S cage compared to the E cage (Bmal1 KO: S vs. E, P = 0.250, post hoc Bonferroni’s comparison). n = 10–11 mice/group. (b) Reciprocal social interaction test. Left: schematic diagram indicates the setup of the test. Middle: bar graphs indicating time spent on nose - anogenital sniffing (t (20) = 4.265, P = 0.0004, Student’s t-test) and nose - nose sniffing (t (20) = 1.685, P = 0.108, Student’s t-test). Right: time spent in interactions including push-crawling and following activities (t (20) = 3.277, P = 0.004, Student’s t-test). n = 11 mice/group. (c) Olfactory habituation test. A schematic diagram is shown on the left. Sniffing time is shown on the right. W: water, C: cinnamon, B: butter, S: social odor (dirty cage swabs). Notably, time spent sniffing the social odor was markedly reduced, whereas time sniffing non-social odors was not changed in the KO mice compared with the WT mice (F (11,55) odor × genotype = 7.168, P < 0.0001, two-way ANOVA). n = 6 mice/group. Data are presented as mean ± standard error of the mean (SEM). ****P < 0.0001. (d) Analysis of mouse grooming. Top: spontaneous grooming. A diagram is on the left and bar graphs are on the right indicating grooming bouts (t (17) = 3.514, P = 0.003, Student’s t-test) and time (t (17) = 0.341, P = 0.372, Student’s t-test). n = 9–10 mice/group. Bottom: water-puff induced grooming. A diagram is shown on the left and bar graphs on the right indicate grooming bouts (t (13) = 3.839, P = 0.002, Student’s t-test) and time (t (13) = 2.365, P = 0.034, Student’s t-test). n = 7–8 mice/group. (e) Analysis of route tracing behavior. Route tracing is defined as a mouse repeatedly following the same route for at least three times on the cage floor. Top: A diagram is shown on the left and trace maps of route tracing episodes (20s) are on the right. Bottom: bar graphs indicate numbers of bouts (t (15) = 3.010, P = 0.009, Student’s t-test), duration (t (15) = 3.786, P = 0.002, Student’s t-test), and percentage of time engaging in route tracing (t (15) = 3.833, P = 0.002, Student’s t-test). n = 8–9 mice/group. All data in (a), (b), (d) and (e) are presented as individual values and mean ± SEM. *P < 0.05, **P < 0.01, ***P < 0.001, ****P < 0.0001, n.s., not significant (Supplementary Fig. 1; see Supplementary Tab. 3 for detailed statistics).
