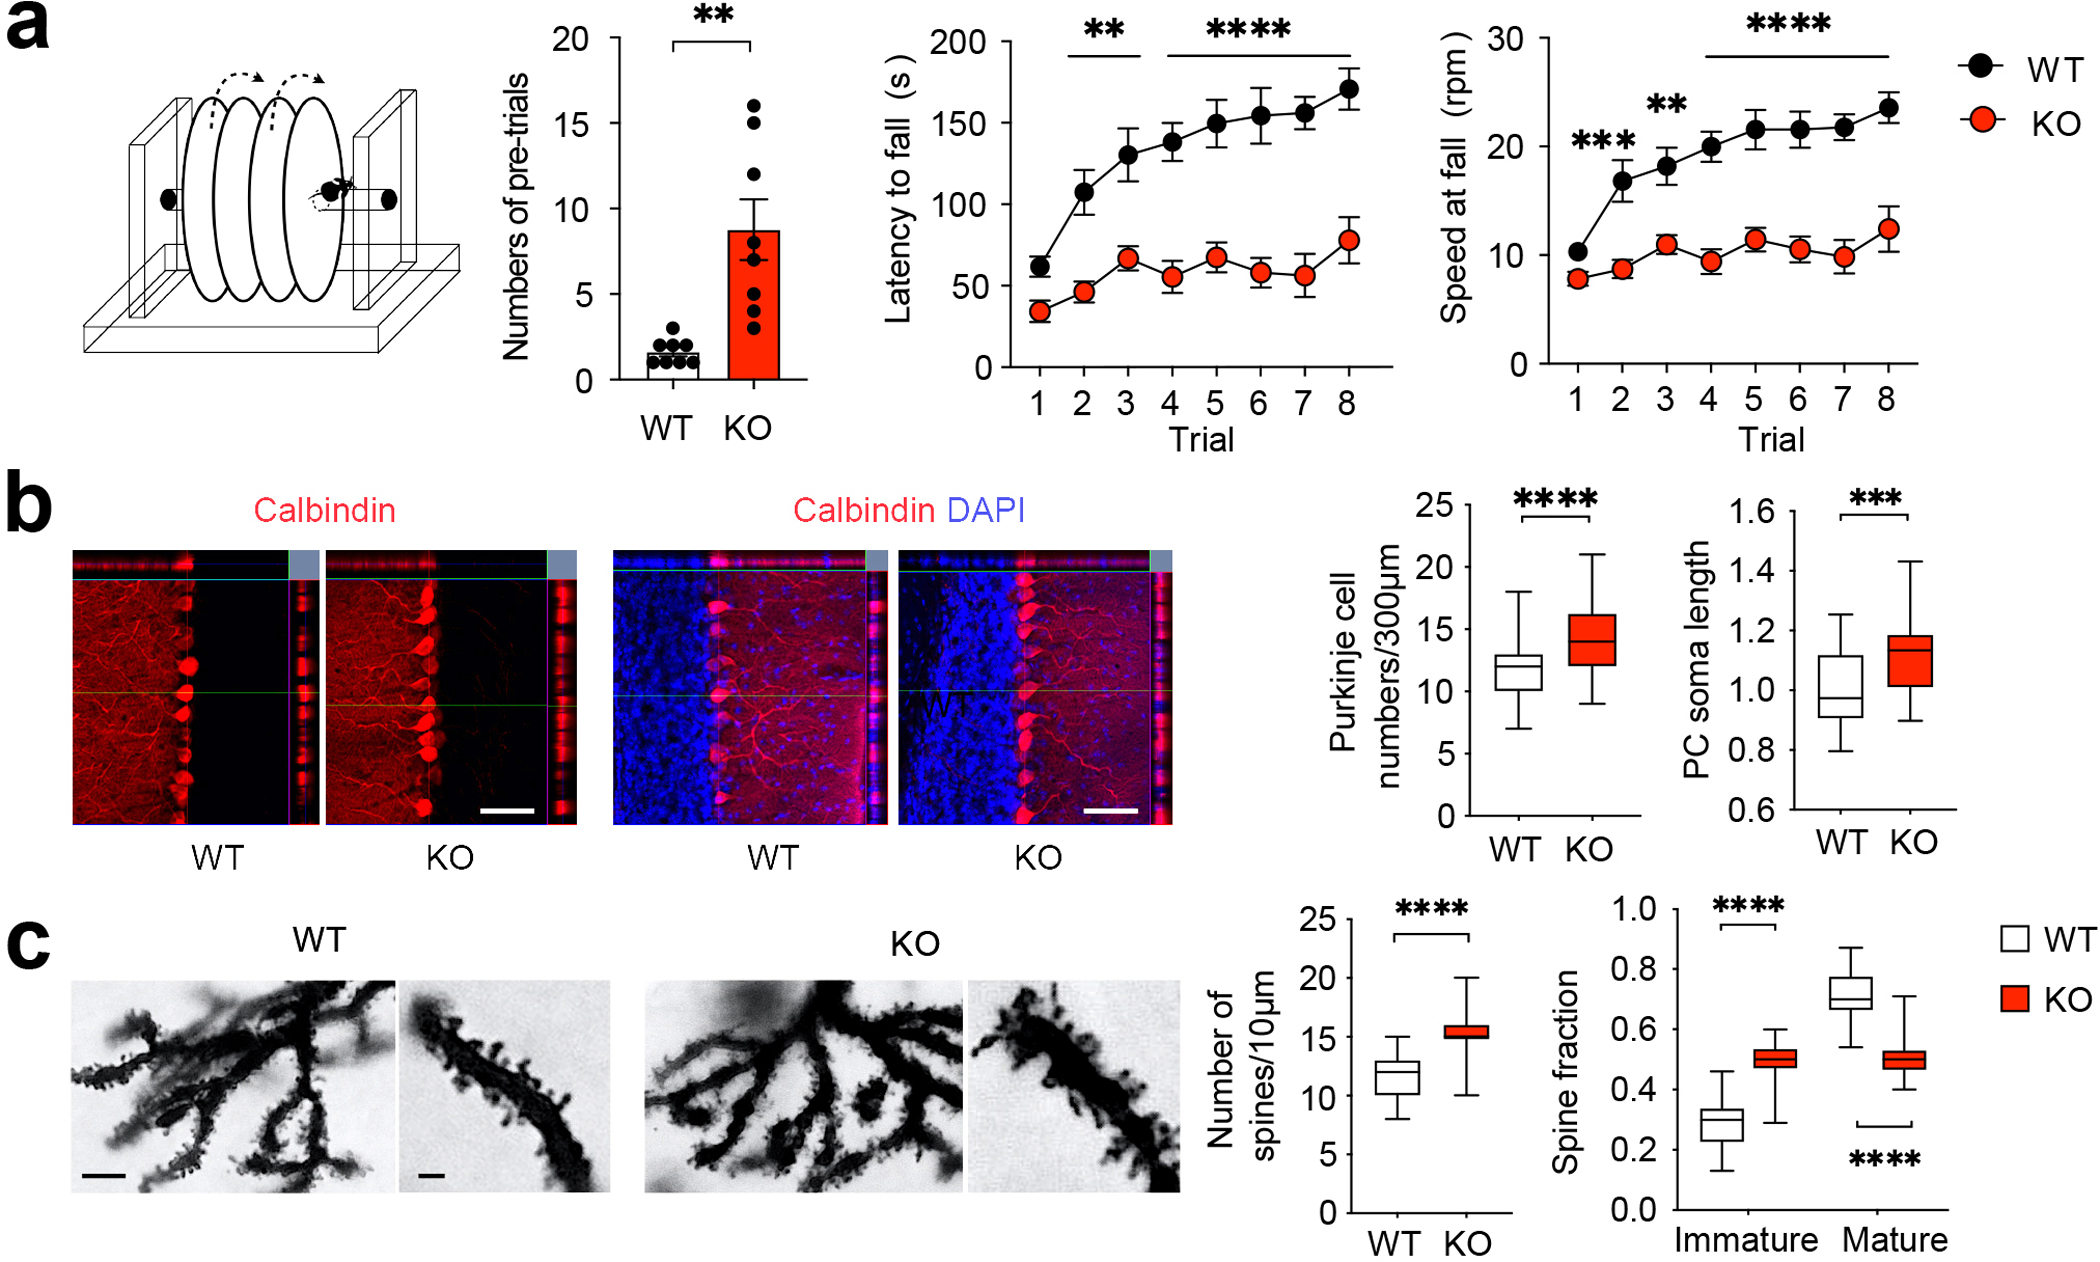
Figure 2. Bmal1 KO mice exhibit motor learning deficits and pervasive pathological changes in the cerebellum.

(a) Mouse rotarod test. Left: A diagram of the rotarod test equipment. Middle: A bar graph indicates numbers of pre-trials (t (14) = 3.981, P = 0.001, Student’s t-test). Note that the Bmal1 KO mice required more pre-training trials before the rotarod test. Right: Line graphs indicate latencies to fall and speeds at fall. Note that the KO mice exhibited markedly shorter latency to fall and lower speed at falling. The performance in KO mice was not improved over the eight trials compared with the WT littermates (F (1,112) genotype = 169.7, P < 0.0001, two-way ANOVA). n = 8 mice/group. Data are shown as mean ± SEM. **P < 0.01, ****P < 0.0001. (b) Expression of Calbindin-D (28k), a Purkinje cell marker. Left: representative microscopic images of cerebellar lobule V immunolabeled for Calbindin-D (red) and counterstained by DAPI (blue). Scale bar = 50 μm. Right: quantitation of Purkinje cell density and soma length is shown in box plots. The whiskers indicate the range from minimum to maximum and the boxes indicate the range from the 25th to 75th percentiles. The lines in the box indicate the medians. Note that Purkinje cell density was increased in the KO cerebellum compared with WT cerebellum (t (103) = 5.493, P < 0.0001, Student’s t-test). n = 50–55 cells, 3–4 mice/group. (c) Golgi-Cox staining of Purkinje cells. Left: representative microscopic images of Golgi-Cox staining indicating dendritic morphology of Purkinje cells. Scale bar = 10 μm for low and 3 μm for high magnification images. Right: Quantitative analysis of density and morphology of dendric spines in box plots. The whiskers indicate the range from minimum to maximum and the boxes indicate the range from the 25th to 75th percentiles. The lines in the box indicate the medians. Note that the number of dendritic spines was increased (t (58) = 8.187, P < 0.0001, Student’s t-test), and more spines were of immature morphology in KO mice compared with WT mice (F (1,116) fraction × genotype = 155.5, P < 0.0001, immature fraction Bmal1 WT vs. Bmal1 KO: P < 0.0001, two-way ANOVA). n = 30 dendrite branches, 3 mice/group. ***P < 0.001, ****P < 0.0001 (Supplementary Fig. 2; see Supplementary Tab.3 for detailed statistics).
