
Figure 4. Altered translational landscape and dysregulated translational control pathways in the cerebellum of Bmal1 KO mice.
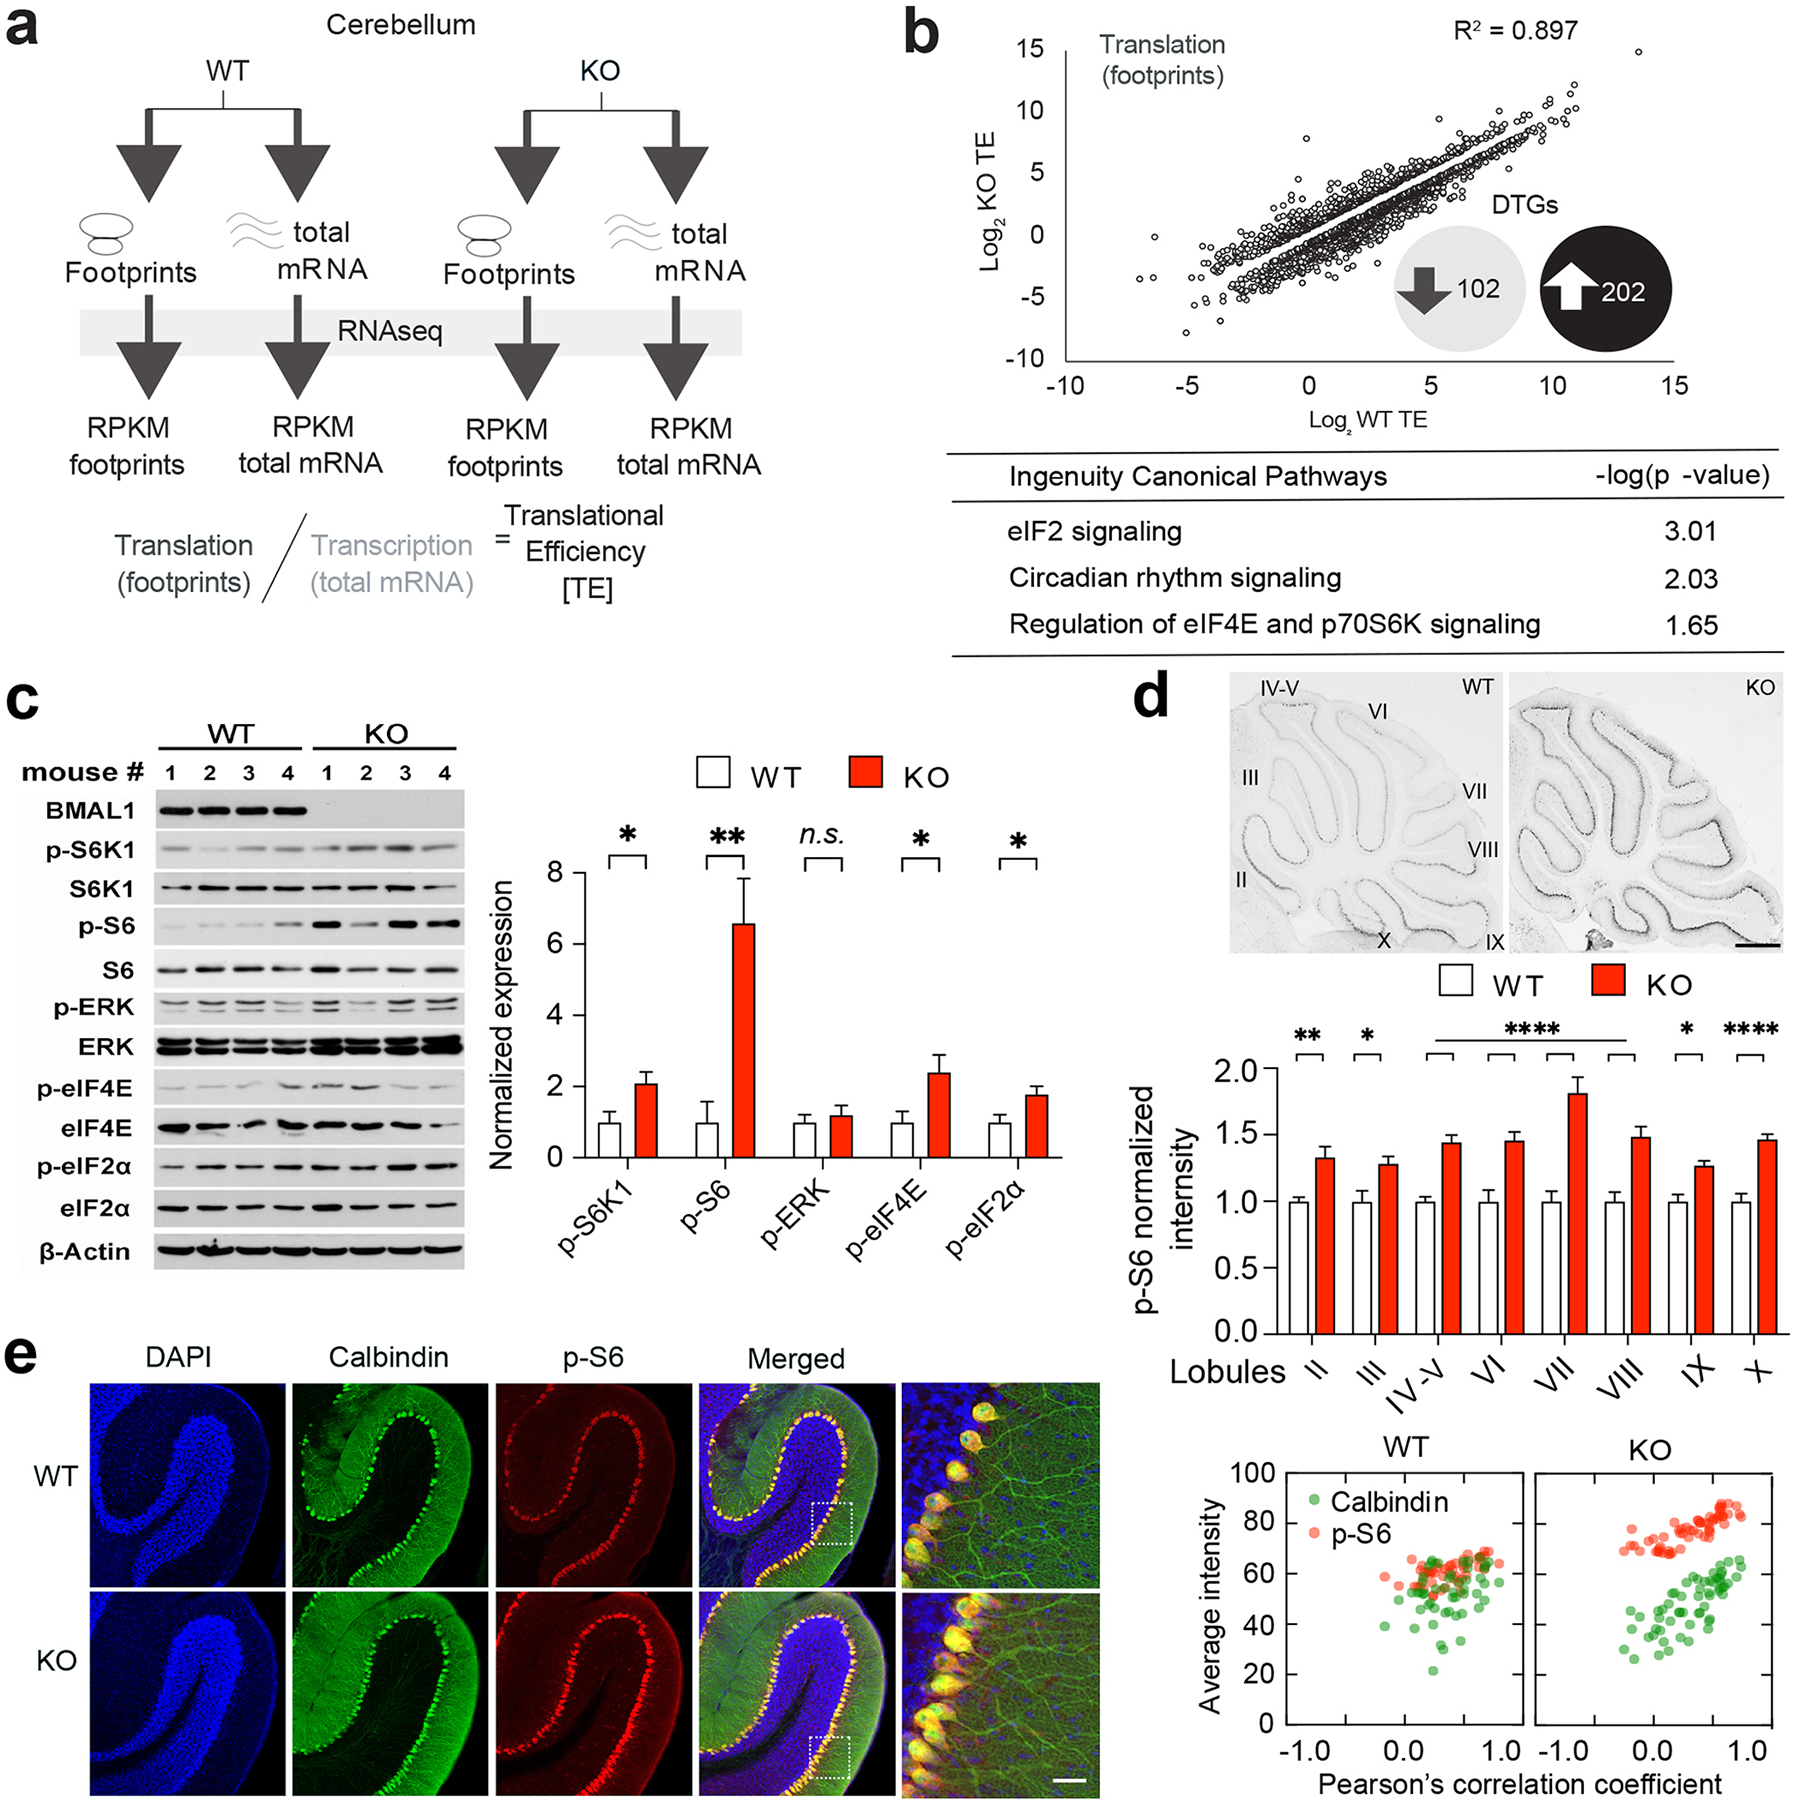
(a) A diagram indicates experimental design to assess genome-wide translational efficiency of mRNAs using ribosome profiling in whole cerebellum tissue. RPKM: Reads Per Kilobase of transcript per Million mapped reads. (b) Top: log2 Translational Efficiency (TE) Plots (P < 0.05 and 1.5 ≥ ratio ≥ 0.667; n = 2 mice/group for footprints and mRNA). DTGs: Differentially Translated Genes, R2: squared Pearson product-moment correlation coefficient. Bottom: Ingenuity Pathway Analysis (IPA) of DTGs. (c) Left: Immunoblots indicating activities of the mTORC1/S6K1, eIF2α, and ERK MAPK/p-eIF4E pathways in the cerebellum using phosphorylated S6K1, S6, eIF2α, ERK and eIF4E as indicators. β-actin was used as a loading control. Right: Quantitation of protein levels of phospho-S6K1 (t (6) = 2.604, P = 0.041), phospho-S6 (t (6) = 4.072, P = 0.007), phospho-eIF2α (t (6) = 2.618, P = 0.040), phospho-ERK (t (6) = 0.629, P = 0.553) and phospho-eIF4E (t (6) = 2.479, P = 0.048). Student’s t-test, n = 4 mice/group. (d) Top: Representative bright field microscopic images of sagittal cerebellar sections immunolabeled for phospho-S6. Scale bar = 500 μm. Bottom: Quantitation of phospho-S6 levels in different cerebellar lobules (F (7,224) lobule × genotype = 3.476, P = 0.002, two-way ANOVA). n = 15 sections, 3 mice/group. In (c) and (d), data are shown as mean ± SEM. *P < 0.05, **P < 0.01, ****P < 0.0001, n.s., not significant. (e) Left: Representative confocal microscopic images of cerebellar sections double immunolabeled for Calbindin-D(28k) (green) and phospho-S6 (p-S6, red). Cell nuclei were counterstained by DAPI (blue). Framed regions are magnified to the right. Scale bar = 20 μm. Right: cellular colocalization analysis of Calbindin-D(28k) and p-S6. n = 51–59 cells, 3 mice/group. Note that Calbindin-D(28k) and p-S6 were colocalized in the Purkinje cell soma and the p-S6 level was increased in the KO mice (Supplementary Figs. 4 and 5; see Supplementary Tab.3 for detailed statistics).