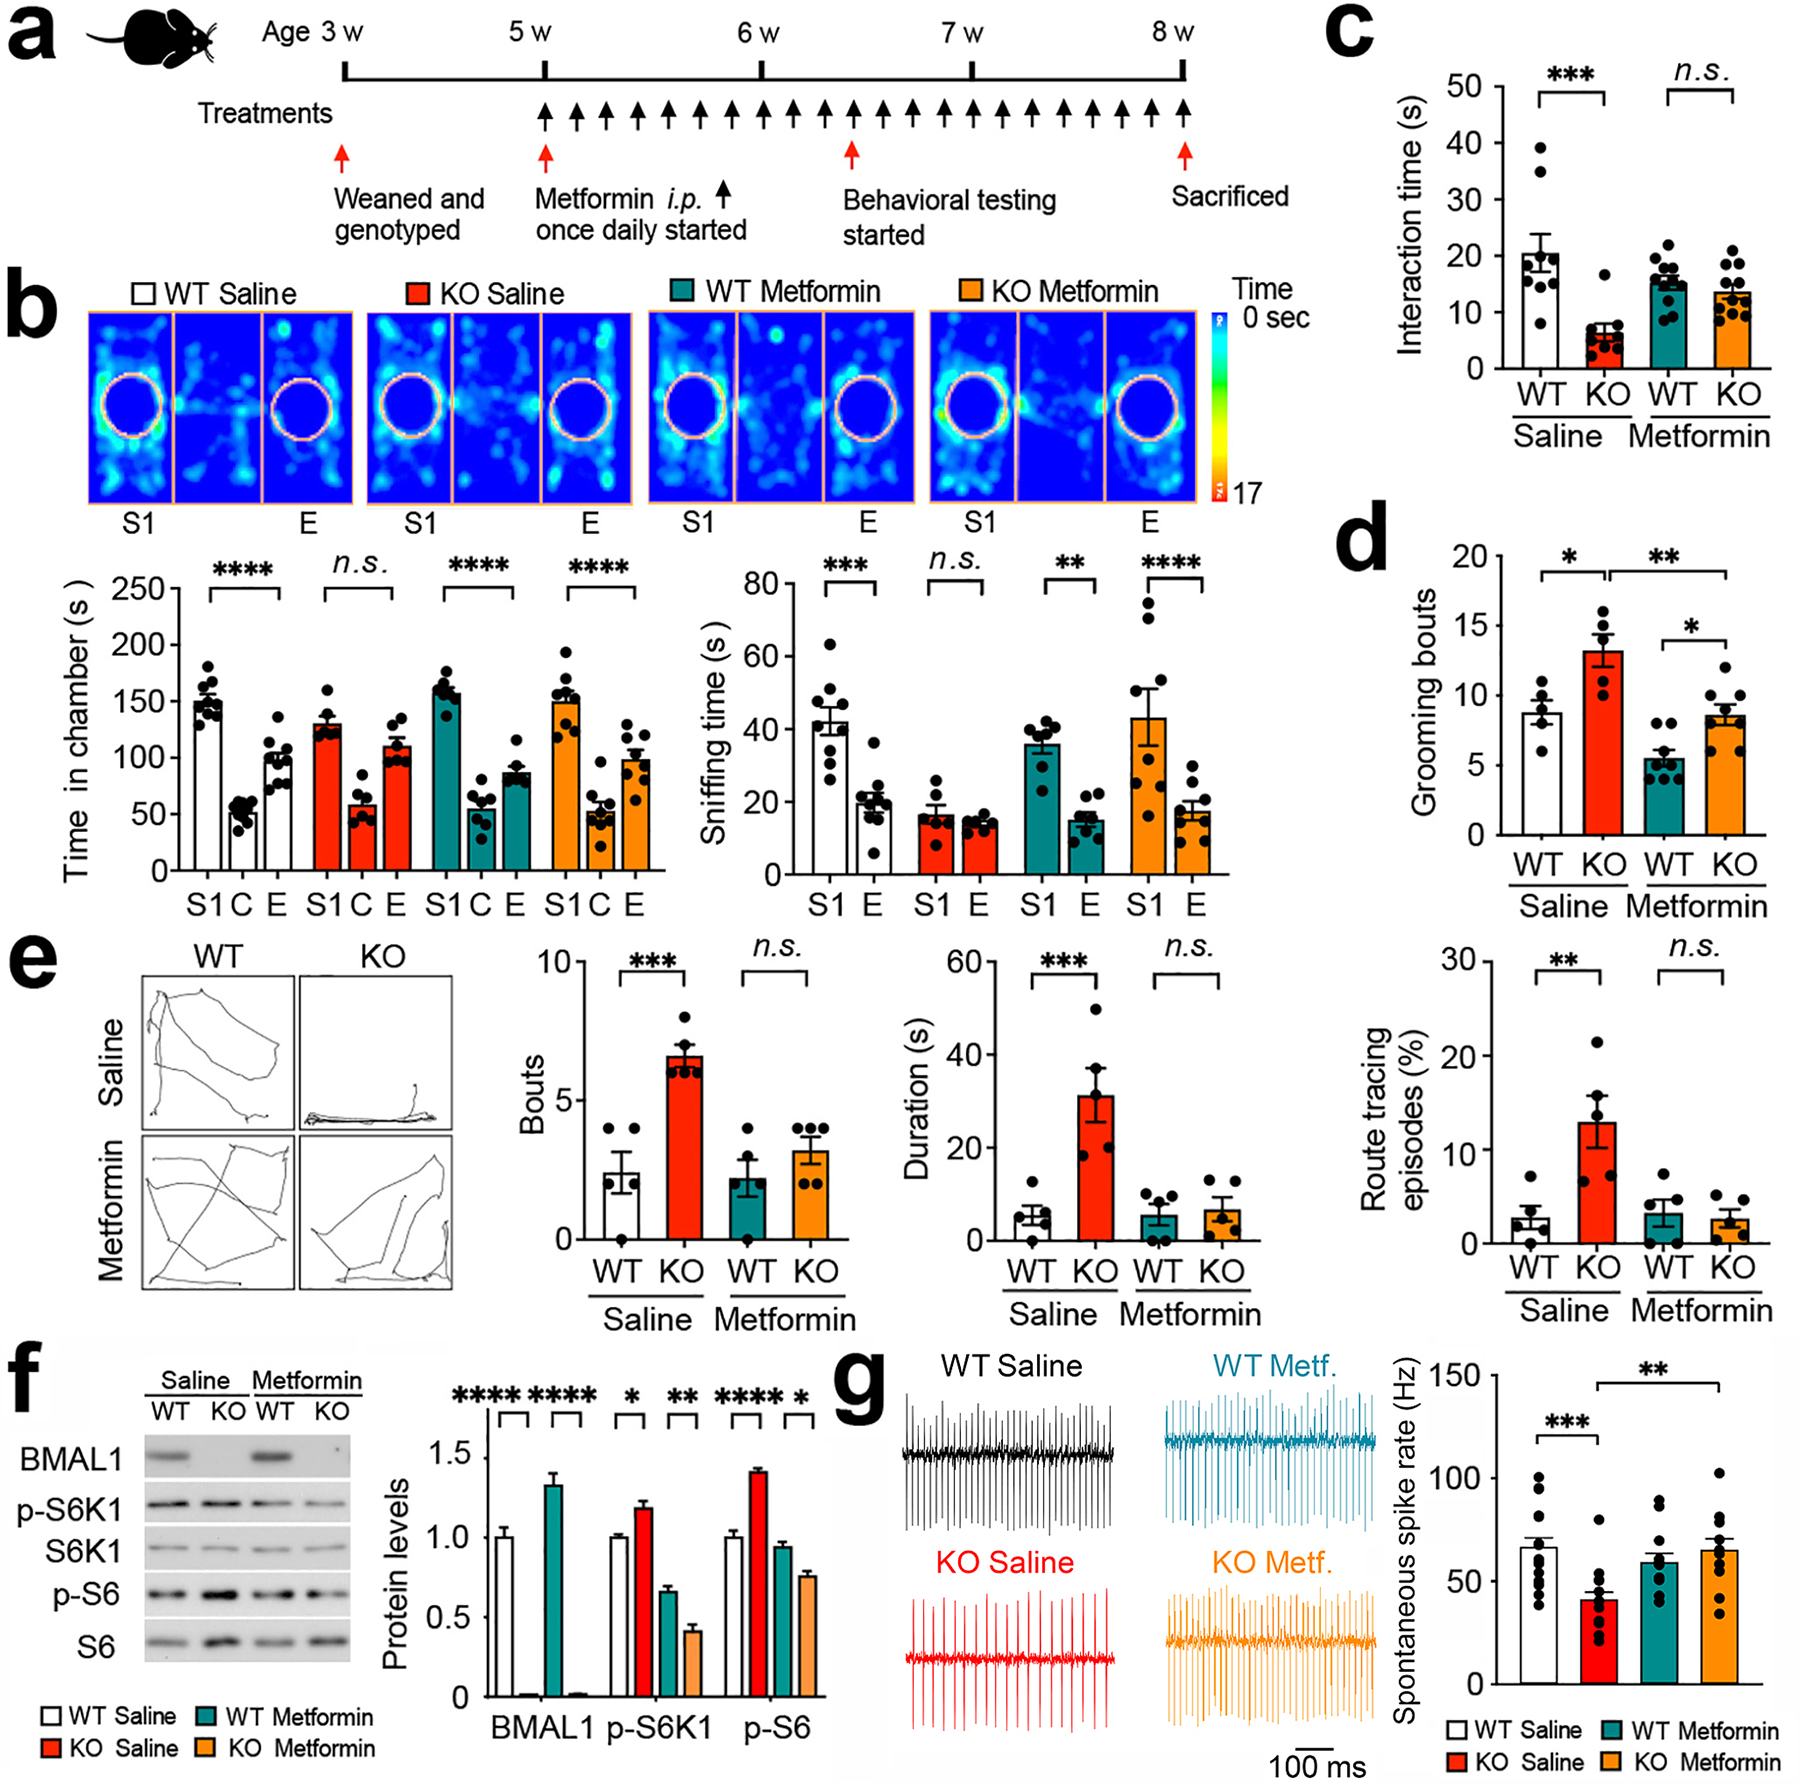
Figure 5. Metformin ameliorates behavioral deficits and reverses cerebellar mTORC1 hyperactivation in Bmal1 KO mice.

(a) A diagram indicating the paradigm used for metformin treatment and tests. Metformin (200 mg/kg, i.p.) or saline (10 μl × body weight in grams, i.p.) was administered once a day at ZT 20 (8 h after light-off) for 10 d to Bmal1 WT and KO mice. Behavioral tests were started at Day 11. Metformin treatment was continued throughout the tests. (b) Three-chamber tests for mouse sociability. Top: Representative heat maps indicating time spent on the location from the four groups. S1: stranger 1, E: empty. Bottom: bar graphs indicate time spent in chambers and in sniffing. Note that metformin treatment reversed the sociability deficits in the Bmal1 KO mice (Bmal1 KO Saline: S1 vs. Empty, P > 0.99; Bmal1 KO Metformin: S1 vs. Empty, P < 0.0001, two-way ANOVA and post hoc Bonferroni’s comparison). n = 6–9 mice/group. (c) Reciprocal social tests. Bar graphs indicate time spent in social interactions. Note that metformin treatment significantly increased the interaction time in KO mice (push-crawl and following) (F (3,35) = 7.672, P = 0.0005, Bmal1 WT Metformin vs. Bmal1 KO Metformin: P = 0.931, one-way ANOVA). n = 8–11 mice/group. (d) Spontaneous grooming analysis. Note that metformin treatment decreased the number of grooming bouts in the Bmal1 KO mice (F (3,22) = 14.660, P < 0.0001, Bmal1 KO Saline vs. Bmal1 KO Metformin: P = 0.004, one-way ANOVA). n = 5–8 mice/group. (e) Route tracing analysis. Left: Trace maps of route tracing episodes (20s). Right: Three bar graphs indicate that metformin treatment significantly decreased the number of bouts, duration, and percentage of time engaging in route tracing in Bmal1 KO mice (Bmal1 WT Metformin vs. Bmal1 KO Metformin: P > 0.999). n = 5 mice/group. (f) Left: representative western blots indicate decreased levels of phospho-S6K1 and phospho-S6 after metformin treatment in the cerebellum of Bmal1 KO mice. Right: Quantitative analysis of the blots. n = 3 mice/group. (g) Cell-attached recordings of spontaneous action potential firing in PCs. Picrotoxin 50 μM, CNQX 20 μM and AP5 50 μM was added to the ACSF to block GABAA, AMPA and NMDA receptors, respectively. Left: representative traces from a Purkinje cell in each group. Right: Quantitative analysis of PC spike rates (WT saline, n = 16; KO saline, n = 15; WT metformin, n = 12; KO metformin, n = 11; one-way ANOVA with post hoc Bonferroni’s comparisons). Data are shown as mean ± SEM. *P < 0.05, **P < 0.01, ***P < 0.001, ****P < 0.0001. n.s., not significant (Supplementary Fig. 6; see Supplementary Table 3 for detailed statistics).
