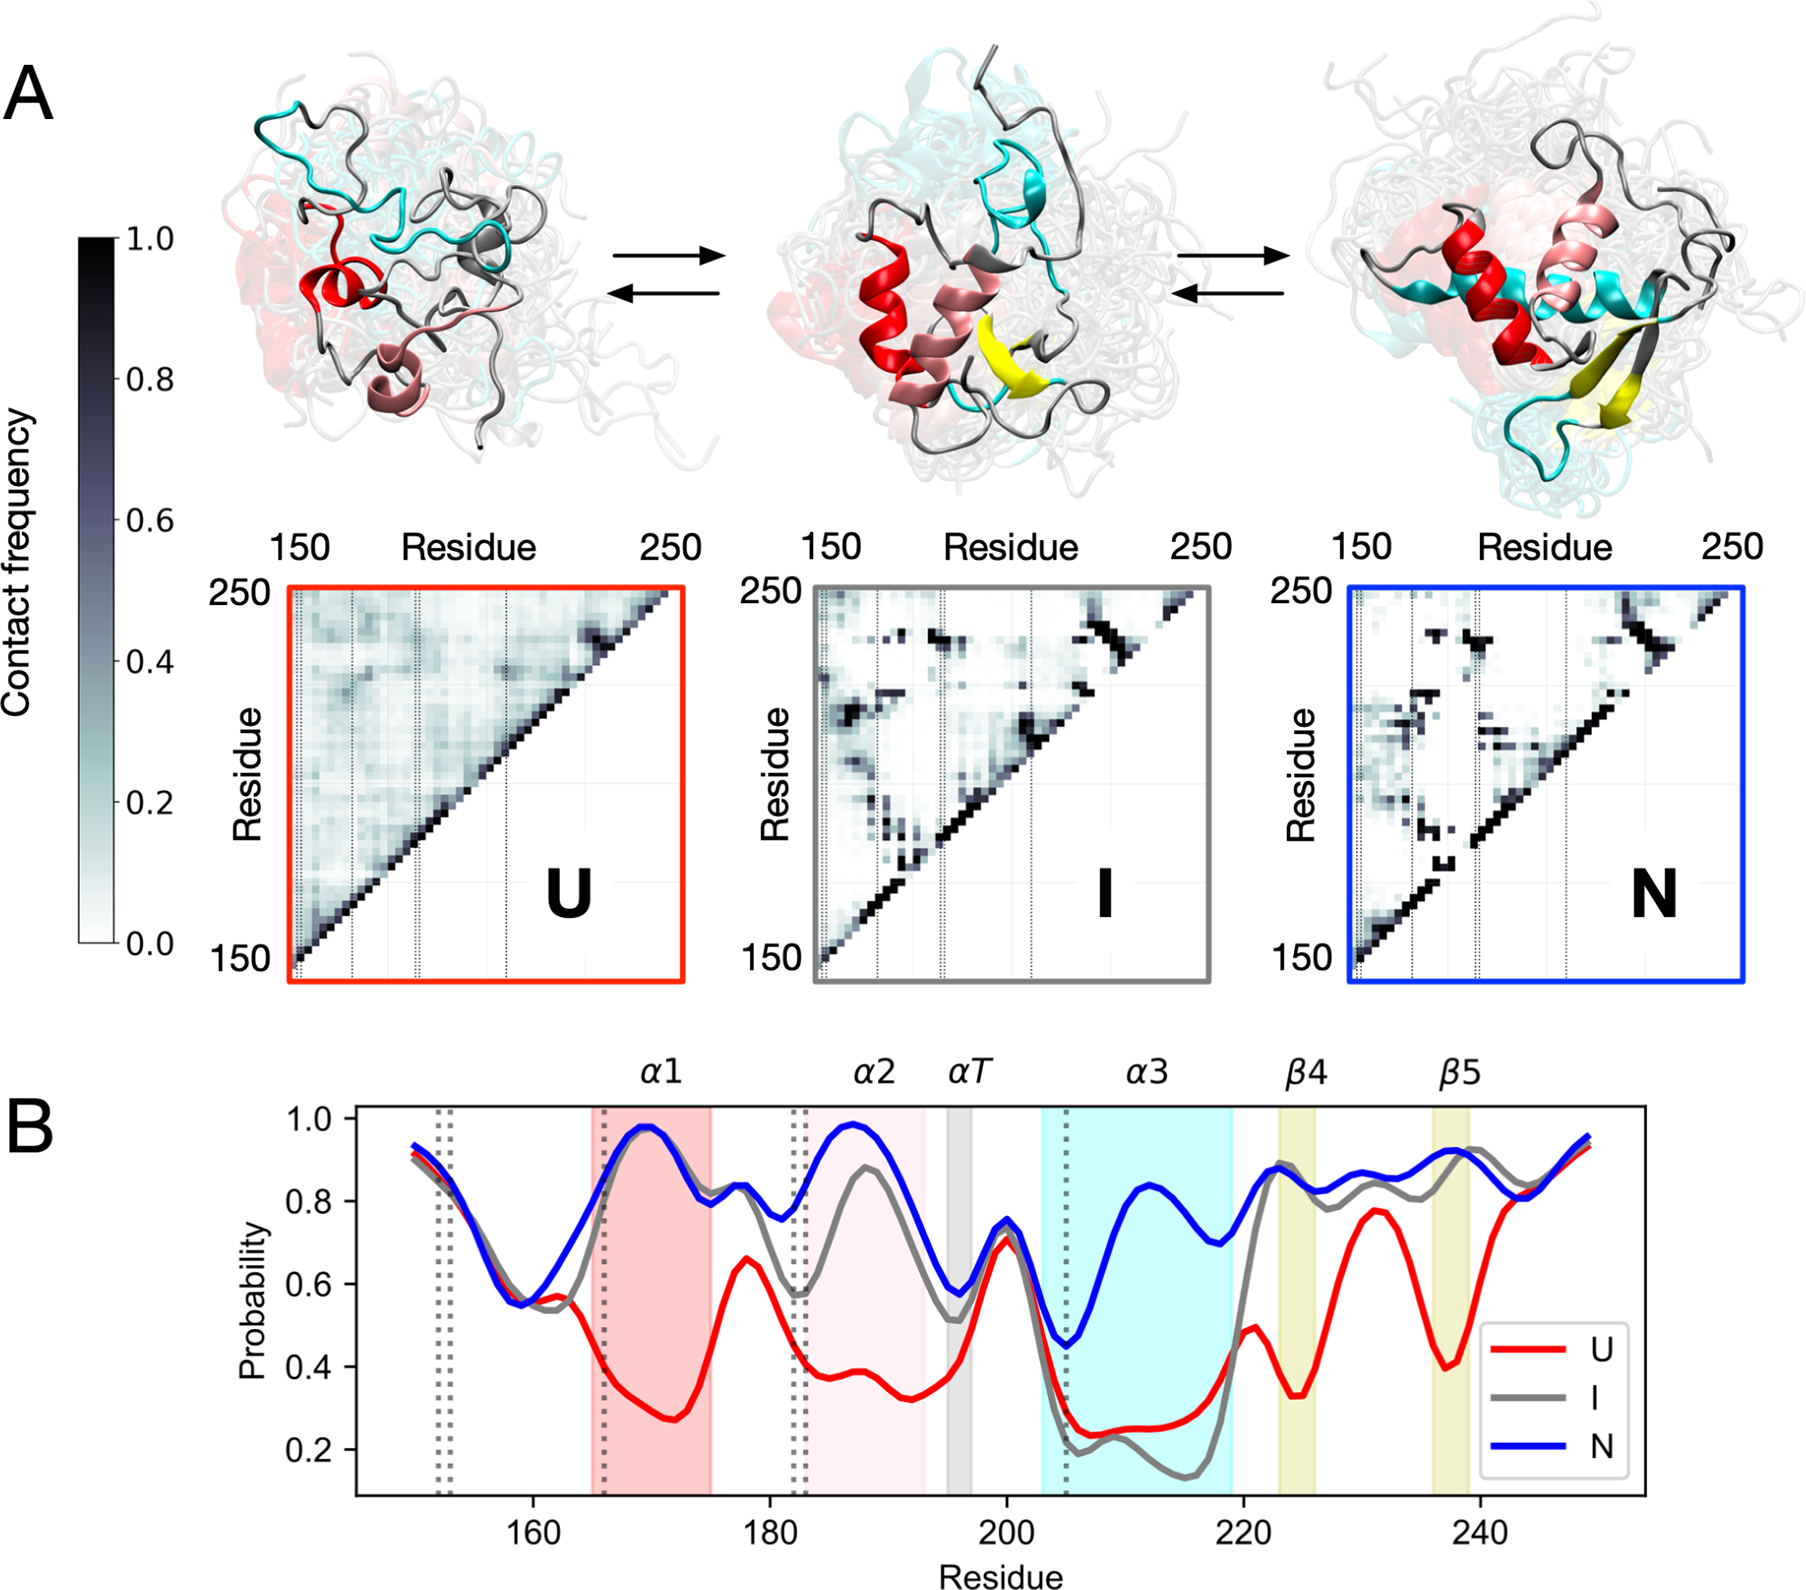
Figure 5.

Simulations predict helix α3 formation to be the final step in folding. (A) Interresidue contact frequencies and representative structures of MSM macrostates U, I and N. Vertical lines on the contact maps denote mutant positions. (B) Per-residue populations of native secondary structure for each macrostate. Shaded bands mark native secondary structures α1, α2, αT, α3, β4 and β5, with vertical lines denoting mutant positions.
