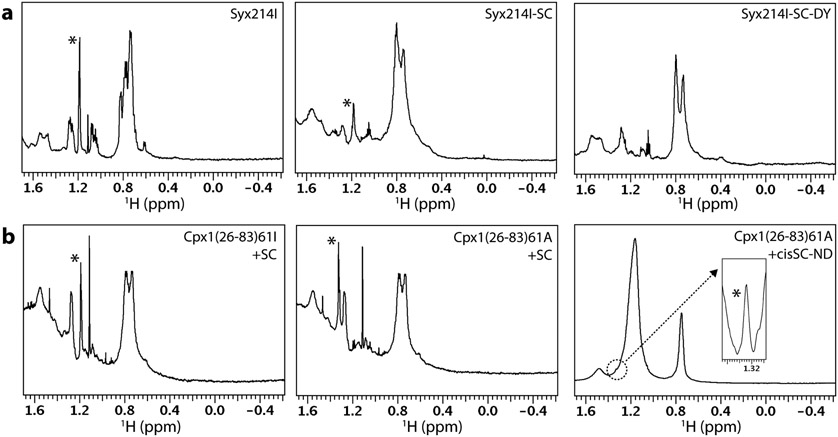
Figure 5.
Gallery of 1D 1H NMR spectra of tBu-labeled presynaptic proteins and complexes. a Expansions corresponding to the methyl region of 1D 1H NMR spectra of Syx214I alone (25 μM, left) or incorporated into the SNARE complex (30 μM) without (middle, Syx214I-SC) or with a Dy3-C2 tag on residue 166 of SNAP-25 (Brewer et al., 2015) (right, Syx214I-SC-DY). b Expansions corresponding to the methyl region of 1D 1H NMR spectra of 18 μM Cpx1(26-83)61I in the presence of 21 μM SNARE complex (left), of 18 μM Cpx1(26-83)A in the presence of 21 μM SNARE complex (middle), and of 8 μM Cpx1(26-83)A in the presence of 12 Cpx1(26-83)A cis-SNARE complex anchored on nanodiscs through the synaptobrevin TM region (right). The inset on the right panel shows an expansion of the region corresponding to the tBu resonance plotted at a much larger vertical scale and with baseline correction to account for the slope of the large lipid resonances that overlap with the tBu signal. The parameters of each spectrum are listed in Table 1. The nanodiscs contained 85% POPC and 15% DOPS. The resonance corresponding to the tBu group in each spectrum is indicated by a *.

