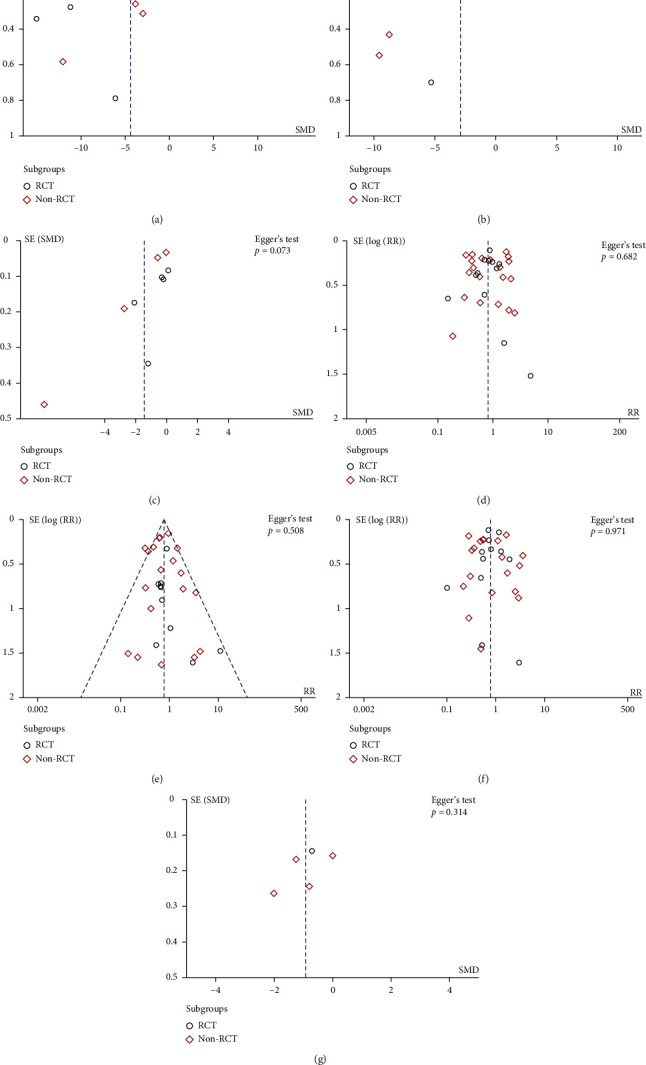
Figure 4.

Funnel plots and Egger's test were used to assess publication bias of (a) TTH, (b) TTA, (c) TTD, (d) total vascular complication rate, (e) major vascular complication rate, (f) bleeding-related complication rate, and (g) patient-reported outcome.
