Fig. 3.
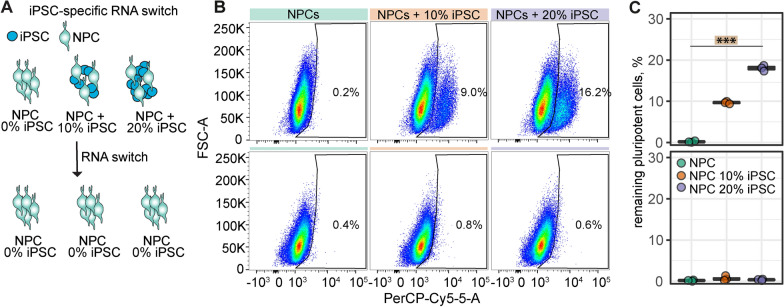
RNA switch for iPSC elimination. A: Schematic representation of RNA switch technology. RNA switch was applied to NPCs without iPSC supplementation (0% iPSC) and with supplementation of 10% and 20% iPSCs. B: Flow Cytometry dot plot of NPCs with negative control switch (upper row) and with RNA switch (lower row). C: Quantification of the remaining percentage of iPSCs in NPC cultures without (top) and with RNA switch (bottom). Boxplots indicate the 25–75% quartiles of the data. Each dot in the plots represents one cell culture well and significance of mean differences between the groups was assessed using Tukey’s HSD. Asterisks indicate significance: *** p < 0.001

