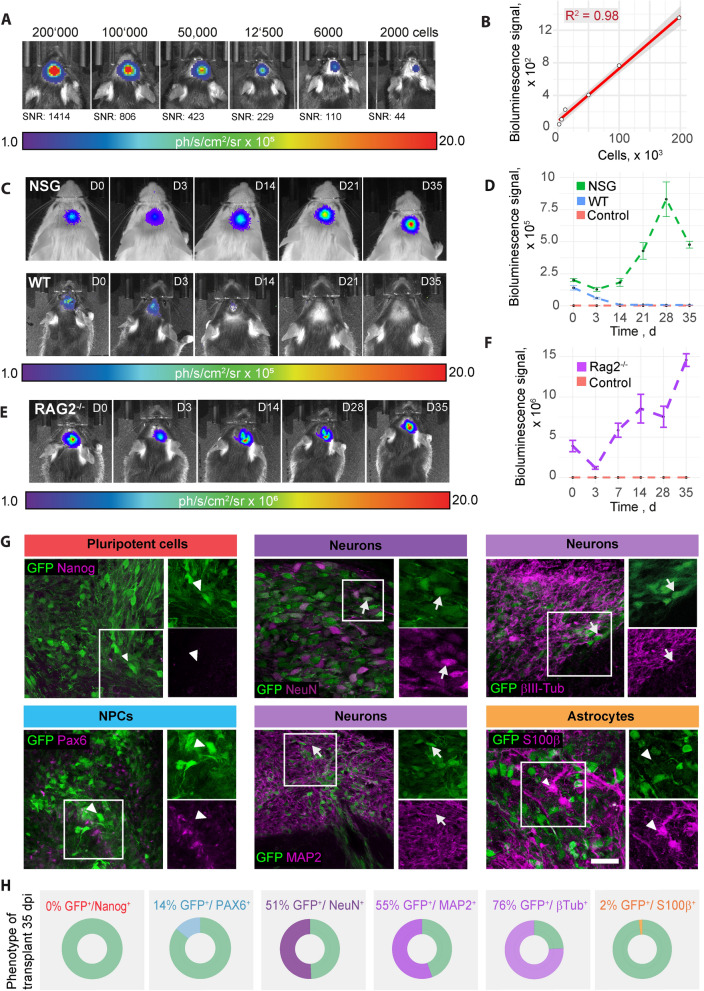
Fig. 5.
Analysis and in vivo tracking of transplanted NPCs. A: Bioluminescence of rFluc-expressing NPCs, transplanted at different numbers into the brain of C57/Bl6 mice at 1.5 h post transplantation. B: Scatter plot including linear regression showing the relation between the bioluminescence signal and the number of transplanted cells. C: Bioluminescence of rFluc-expressing NPCs, transplanted into NSG (upper row) and C57/Bl6 mice (lower row), over the course of 35d, measured by in vivo bioluminescence imaging. 1.6 × 10⁵ cells have been transplanted. D: BLI signal intensity over time (mean ± SEM per strain, SBR). E: Bioluminescence of rFluc-expressing NPCs, transplanted into stroked Rag2-/- mice. F: BLI signal intensity over time (mean ± SEM per strain, SBR). G: Representative histological stainings of transplanted NPCs, 35d post transplantation in stroked Rag2−/− mice. Arrowheads indicate GFP-expressing cells that are negative for the respective maker. Arrows indicate positivity for marker and GFP. Scale bar = 50um. H: Quantification of cells positive for the respective marker and for GFP. BLI bioluminescence imaging, SNR Signal-to-noise ratio, WT wild-type, NSG: NOD scid gamma. Line graphs are plotted as mean ± sem

