Fig. 10.
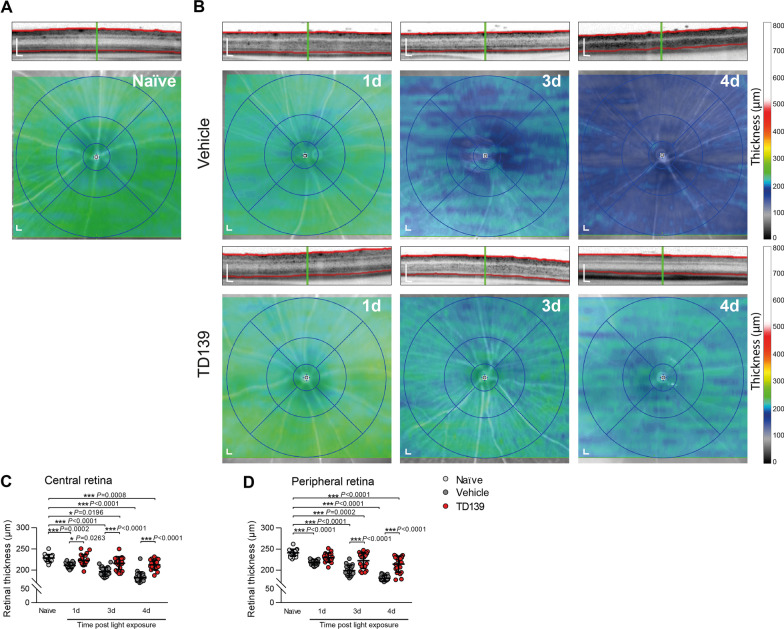
TD139 delays light-induced retinal degeneration. Representative SD-OCT scans and heat maps of retinal thickness from naïve (A) and light-exposed mice treated with vehicle or TD139 (B). Scale bar: 200 µm. Quantification of the averaged thickness of the central retina (circle diameter 3 mm) (C) and peripheral retina (circle diameter 6 mm) (D). Data show mean ± SEM. Naïve n = 20; Vehicle/TD139: 1d n = 19/20; 3d n = 20; 4d n = 19/20 eyes. *P < 0.05 and ***P ≤ 0.001 by ordinary one-way ANOVA followed by Tukey’s multiple comparisons

