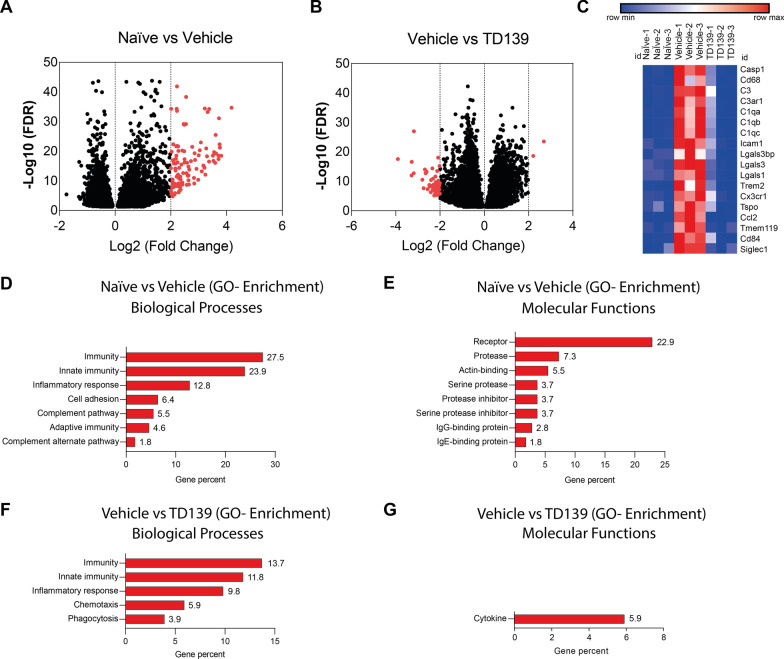
Fig. 8.
Global transcriptomic changes of retinas from naïve and light-exposed mice treated with vehicle or TD139. Volcano plots derived from RNA-sequencing data showing the comparison of differentially expressed genes (DEGs) from naïve mice versus vehicle-treated mice (A) and the comparison between light-exposed mice treated with vehicle versus TD139 (B). C Heat map showing the expression changes of selected DEGs in retinas from naïve animals and light-exposed mice treated with vehicle or TD139. Gene ontology (GO) enrichment analysis (biological processes and molecular functions) of DEGs from naïve mice versus vehicle-treated mice (D, E) and DEGs from light-exposed mice treated with vehicle versus TD139 (F, G). Relative gene percentage is indicated for each bar. n = 3 biological replicates using retinas from individual mice

