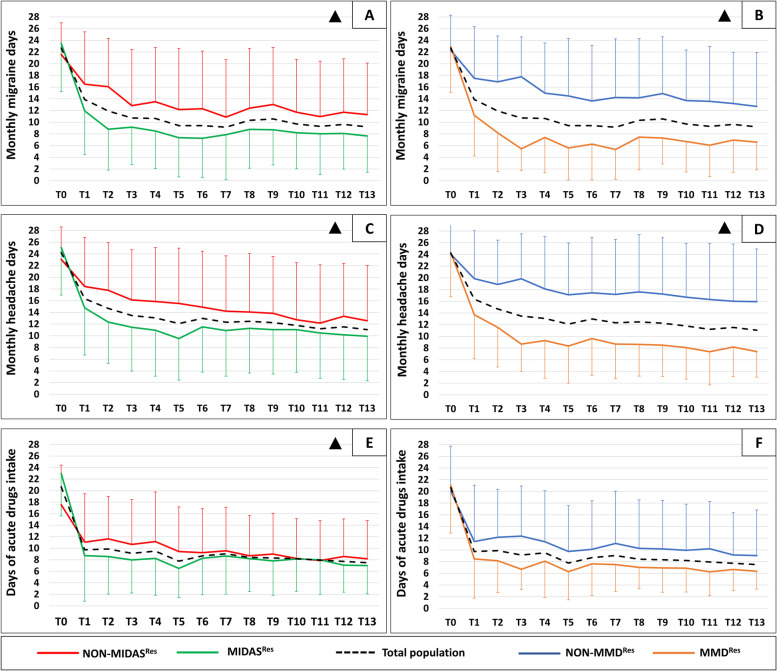
Fig. 3.
Changes in monthly migraine days, monthly headache days, and days of acute drugs intake in MIDASRes and MMDRes groups. MIDAS: MIgraine Disability Assessment. MIDASRes (green lines): Patients with a MIDAS score reduction of at least 50% at T3. NON-MIDASRes (red lines): Patients with a MIDAS score reduction < 50% at T3. MMDRes (orange lines): Patients with a MMDs reduction of at least 50% at T3. NON-MMDRes (blu lines): Patients with a MMDs reduction < 50% at T3. Black dotted lines represent changes in the overall study population. Δ: TIMExGROUP interaction < 0.050. Statistical analysis was performed with a non-parametric test for repeated measures, with the following factors: TIME: changes in the overall study population across the 1-year treatment period; GROUP: overall difference between study groups; TIMExGROUP interaction: different behavior of study groups across the 1-year treatment period. A: difference in monthly migraine days between MIDASRes and NON-MIDASRes groups. TIME = p < 0.001, GROUP = p = 0.034, TIMExGROUP = p = 0.045. B: difference in monthly migraine days between MMDRes and NON-MMDRes groups. TIME = p < 0.001, GROUP = p < 0.001, TIMExGROUP = p < 0.001. C: difference in monthly headache days between MIDASRes and NON-MIDASRes groups. TIME = p < 0.001, GROUP = p = 0.099, TIMExGROUP = p = 0.005. D: difference in monthly headache days between MMDRes and NON-MMDRes groups. TIME = p < 0.001, GROUP = p < 0.001, TIMExGROUP = p < 0.001. E: difference in days of acute drugs intake between MIDASRes and NON-MIDASRes groups. TIME = p < 0.001, GROUP = p = 0.424, TIMExGROUP = p = 0.045. F: difference in days of acute drugs intake between MMDRes and NON-MMDRes groups. TIME = p < 0.001, GROUP = p = 0.078, TIMExGROUP = p = 0.323

