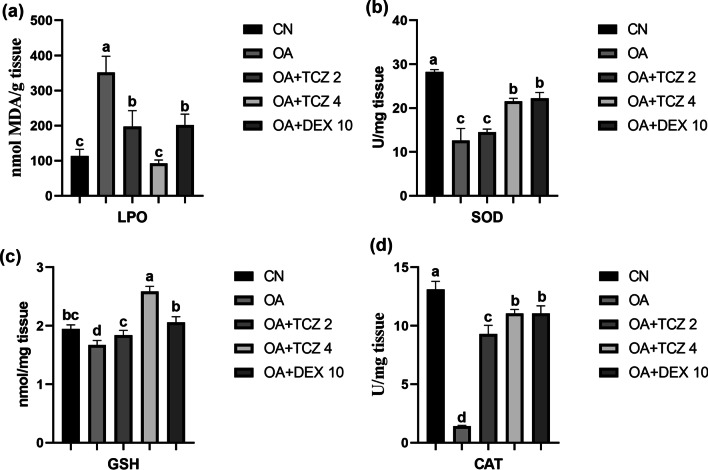
Fig. 3.
a In lung tissues, LPO levels were significantly increased in the OA group (P < 0.05) and were significantly decreased in the DEX and TCZ groups (P < 0.05). b SOD activity was significantly decreased in the OA and OA + TCZ-2 groups (P < 0.05), while it was significantly increased in the OA + TCZ-4 and OA + DEX-10 groups compared to the OA group (P < 0.05). c In the OA + TCZ-4 group, GSH levels were significantly increased compared to the OA and other experimental groups (P < 0.05). d CAT activity was significantly decreased in the OA group (P < 0.05), while it was significantly increased in all other experimental groups compared to the OA group (P < 0.05). Different letters (a, b, c, d) above bars indicate statistical differences between control and experimental groups according to Tukey’s multiple range test (P < 0.05)

