Fig. 5.
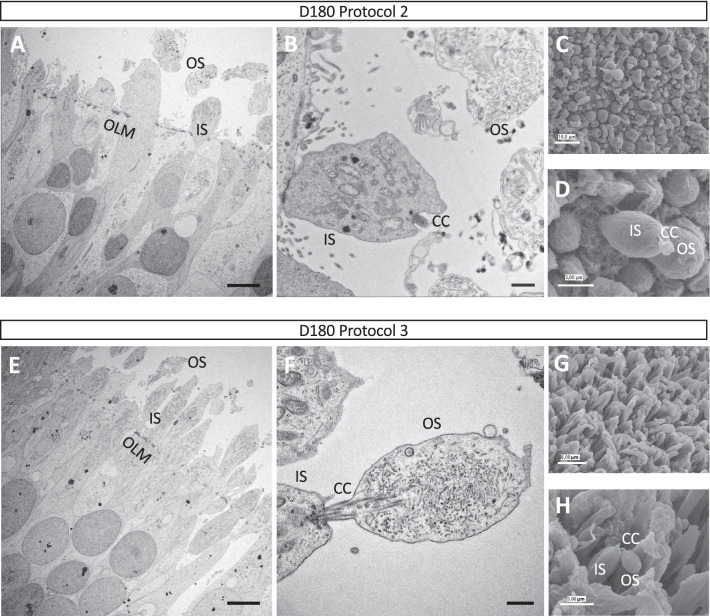
Ultrastructure and surface analysis of retinal organoids. Representative images of transmission EM analysis of D180 Protocol 2 (A) and Protocol 3 (E) organoids showing the ultrastructure of the ONL. The outer limiting membrane (OLM), the inner segments (IS) and the outer segment (OS)-like structures of the photoreceptors are indicated. Scale bars = 5 μm. Higher magnification images of Protocol 2 (B) and Protocol 3 (F) organoids showing in more detail the ultrastructure of the IS and OS-like structures of the photoreceptors, as well as the connecting cilium (CC). Scale bars = 1 μm (B) and 500 nm (F). Representative scanning EM images of Protocol 2 (C) and Protocol 3 (G) organoids showing the differential cellular shape of the predominant cones and rods, respectively. Higher magnification images showing the IS, CC and OS-like structures of photoreceptors for Protocol 2 (D) and Protocol 3 (H). Scale bars = 10 μm (C), 3 μm (D), 8 µm (G) and 3 µm (H)

