Figure 5.

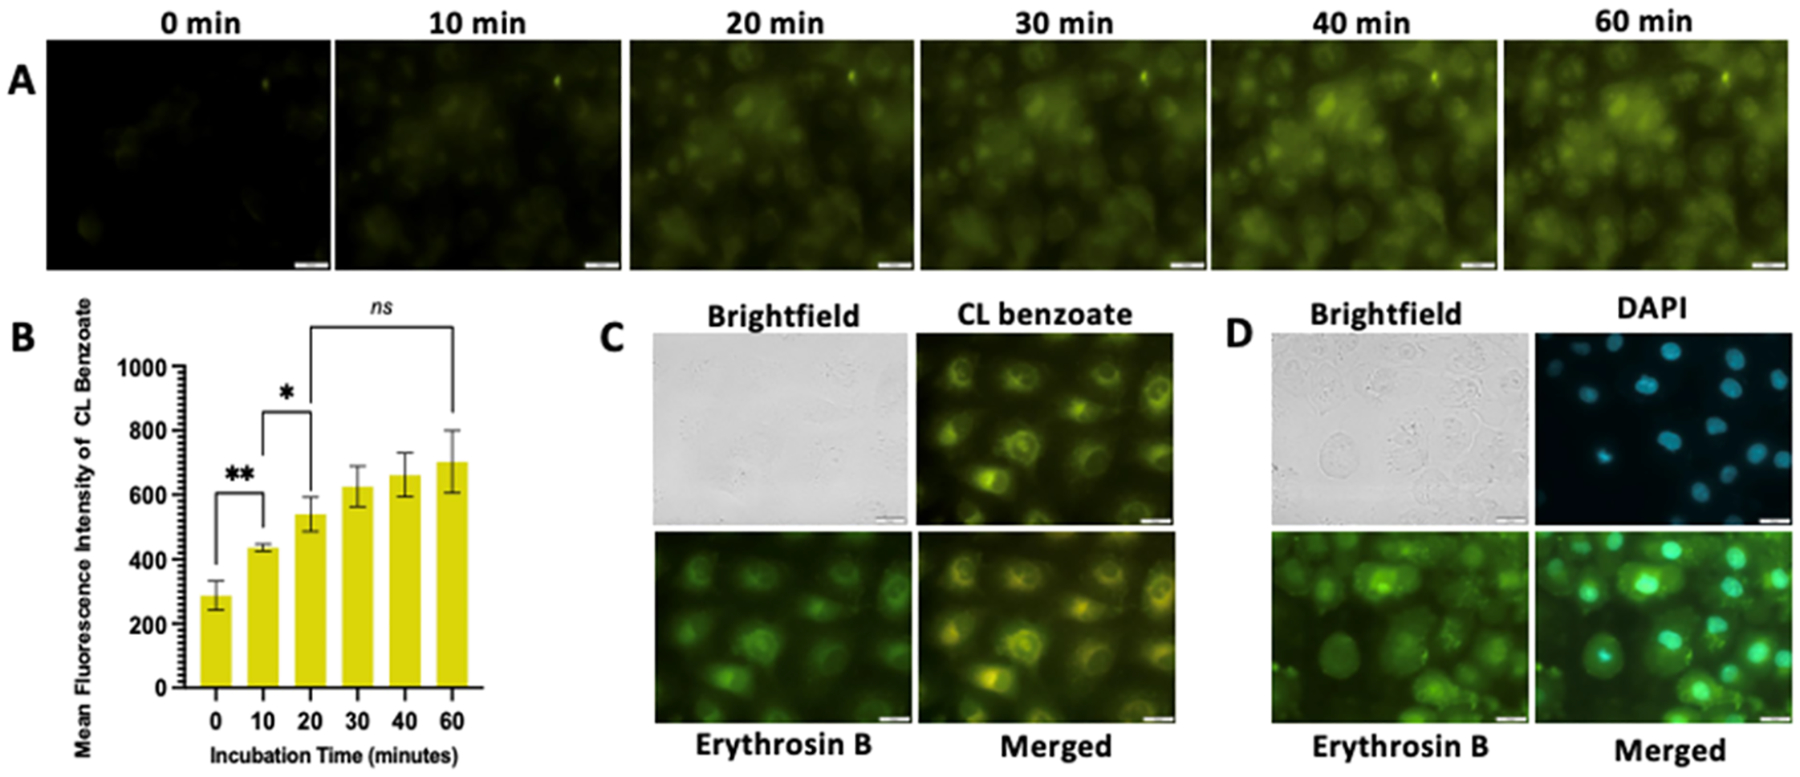
Intracellular uptake and cellular localization of CL-E1. (A) Fluorescence time course of MCF7 breast cancer cells incubated with 10 μM CL-E1 for a total of 60 min. The benzoate ester product expected produces yellow fluorescence upon excitation (λex 400 nm) with increasing fluorescence up to maximum signals between 20 and 40 min of incubation with CL-E1. (B) Quantification of the mean fluorescence intensity for the benzoate ester product. Data for 0 min incubation represent the cells imaged immediately after addition of CL-E1. Analyzed by the two-tailed t-test, p-value <0.0001 indicated by ****, p-value = 0.0076 indicated by **, and p-value >0.05 is not significant. (C) MCF7 breast cancer cells incubated with 10 μM CL-E1 for 20 min. The benzoate ester product expected produces yellow fluorescence (top right) upon excitation (λex 400 nm), and the attached photosensitizer Erythrosin B to the CL scaffold shows green fluorescence (bottom left) (λex 509 nm). Yellow fluorescence and green fluorescence overlay well with each other (bottom right), demonstrating the same cellular localization. (D) Nuclear costain with DAPI (5 μM) (top right) overlayed (bottom right) with green fluorescence from Erythrosin B (bottom left). Additional imaging of the benzoate ester with nuclear costain is not feasible due to the excitation and emission properties interfering with those of DAPI. 40×, scale bar = 25 μm. Experiments were performed in triplicate using independent samples.
