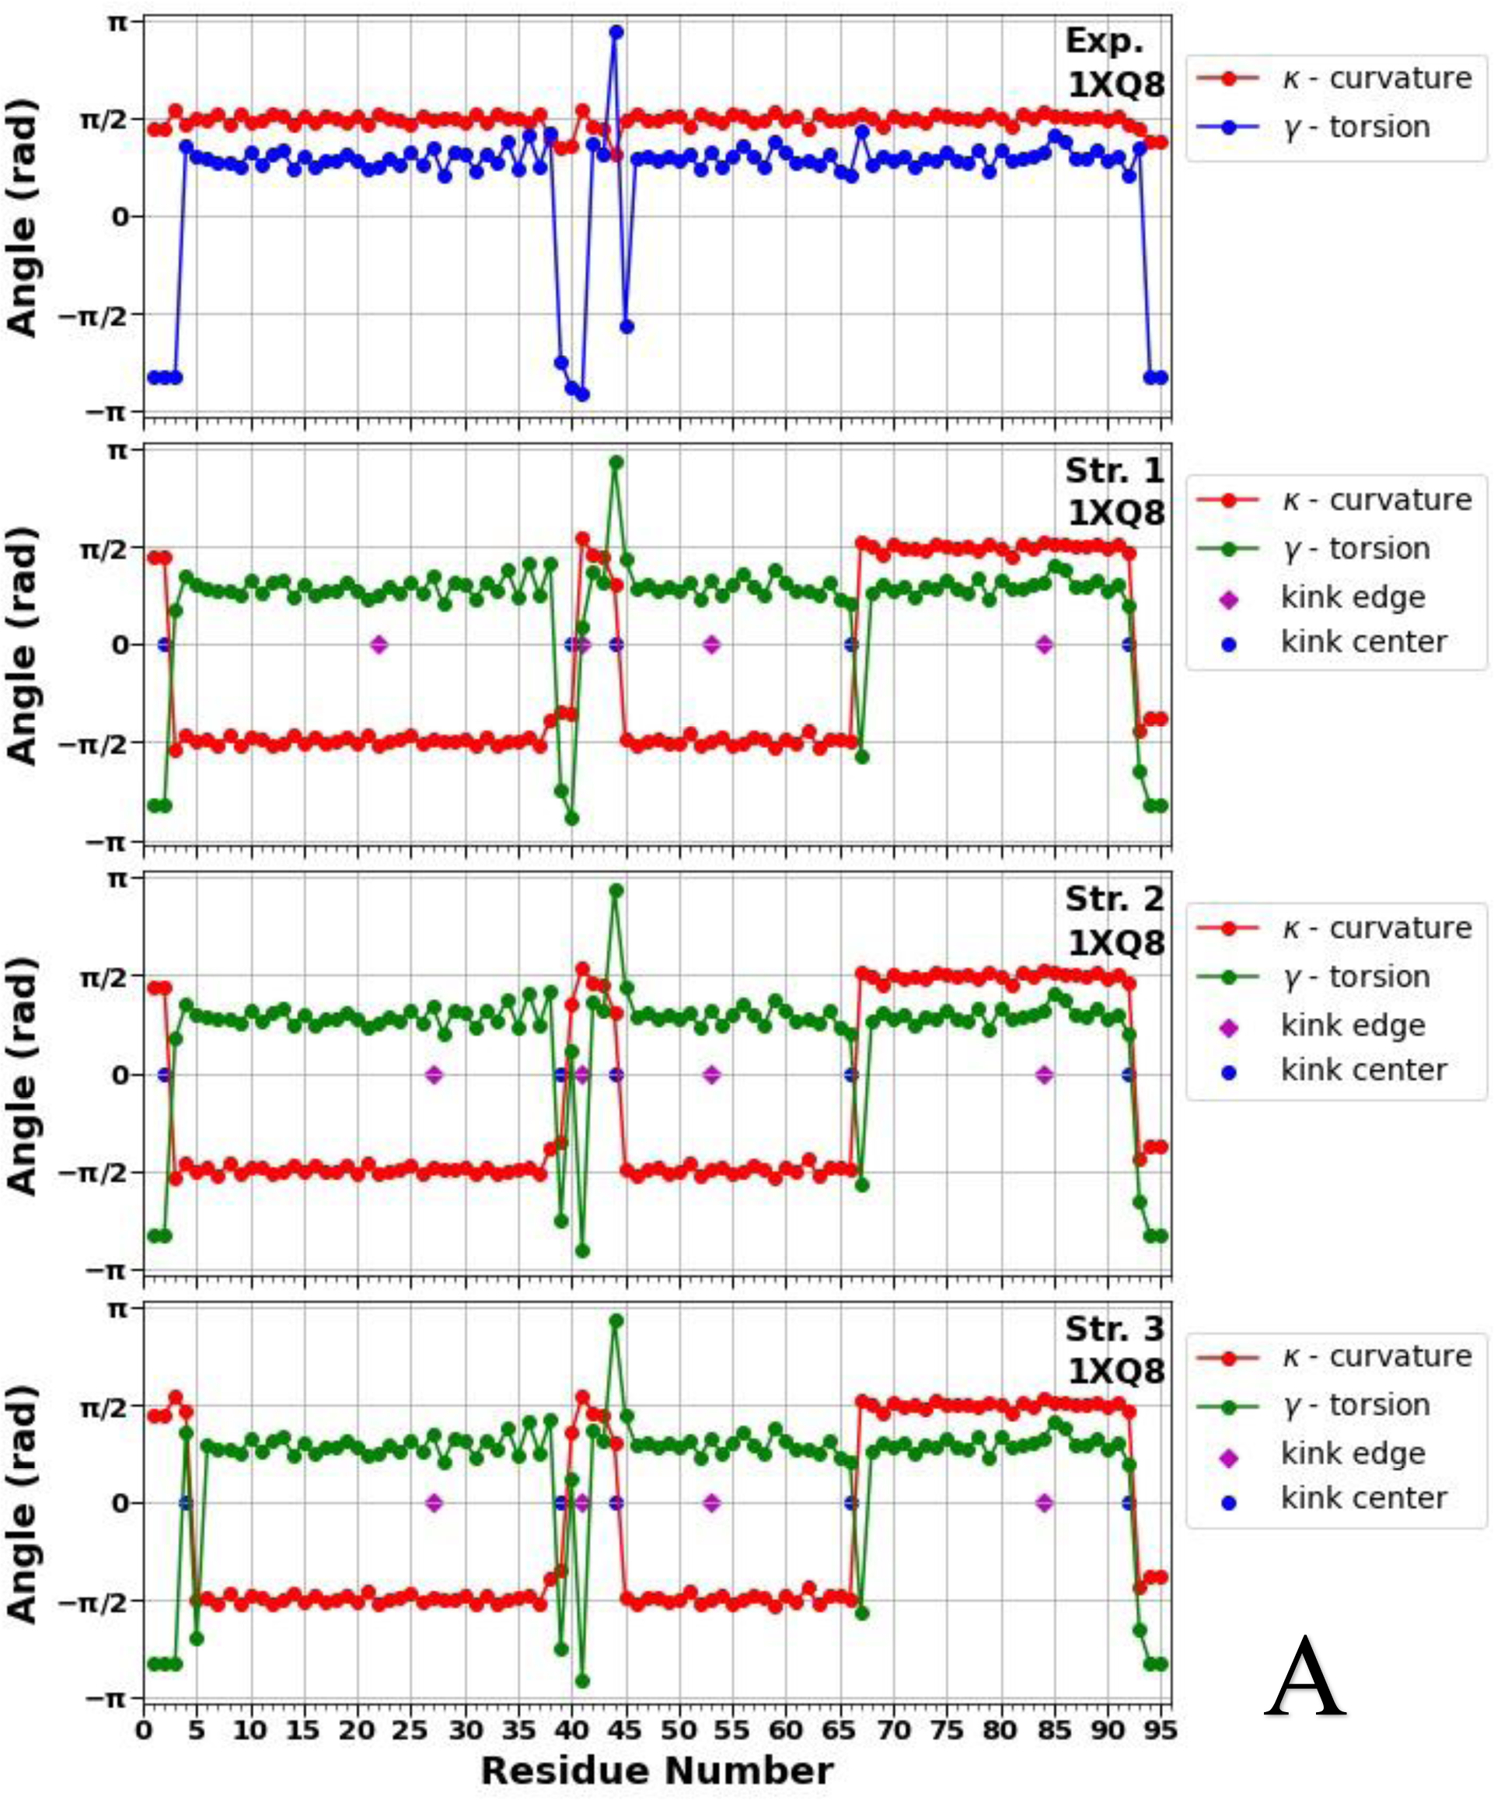
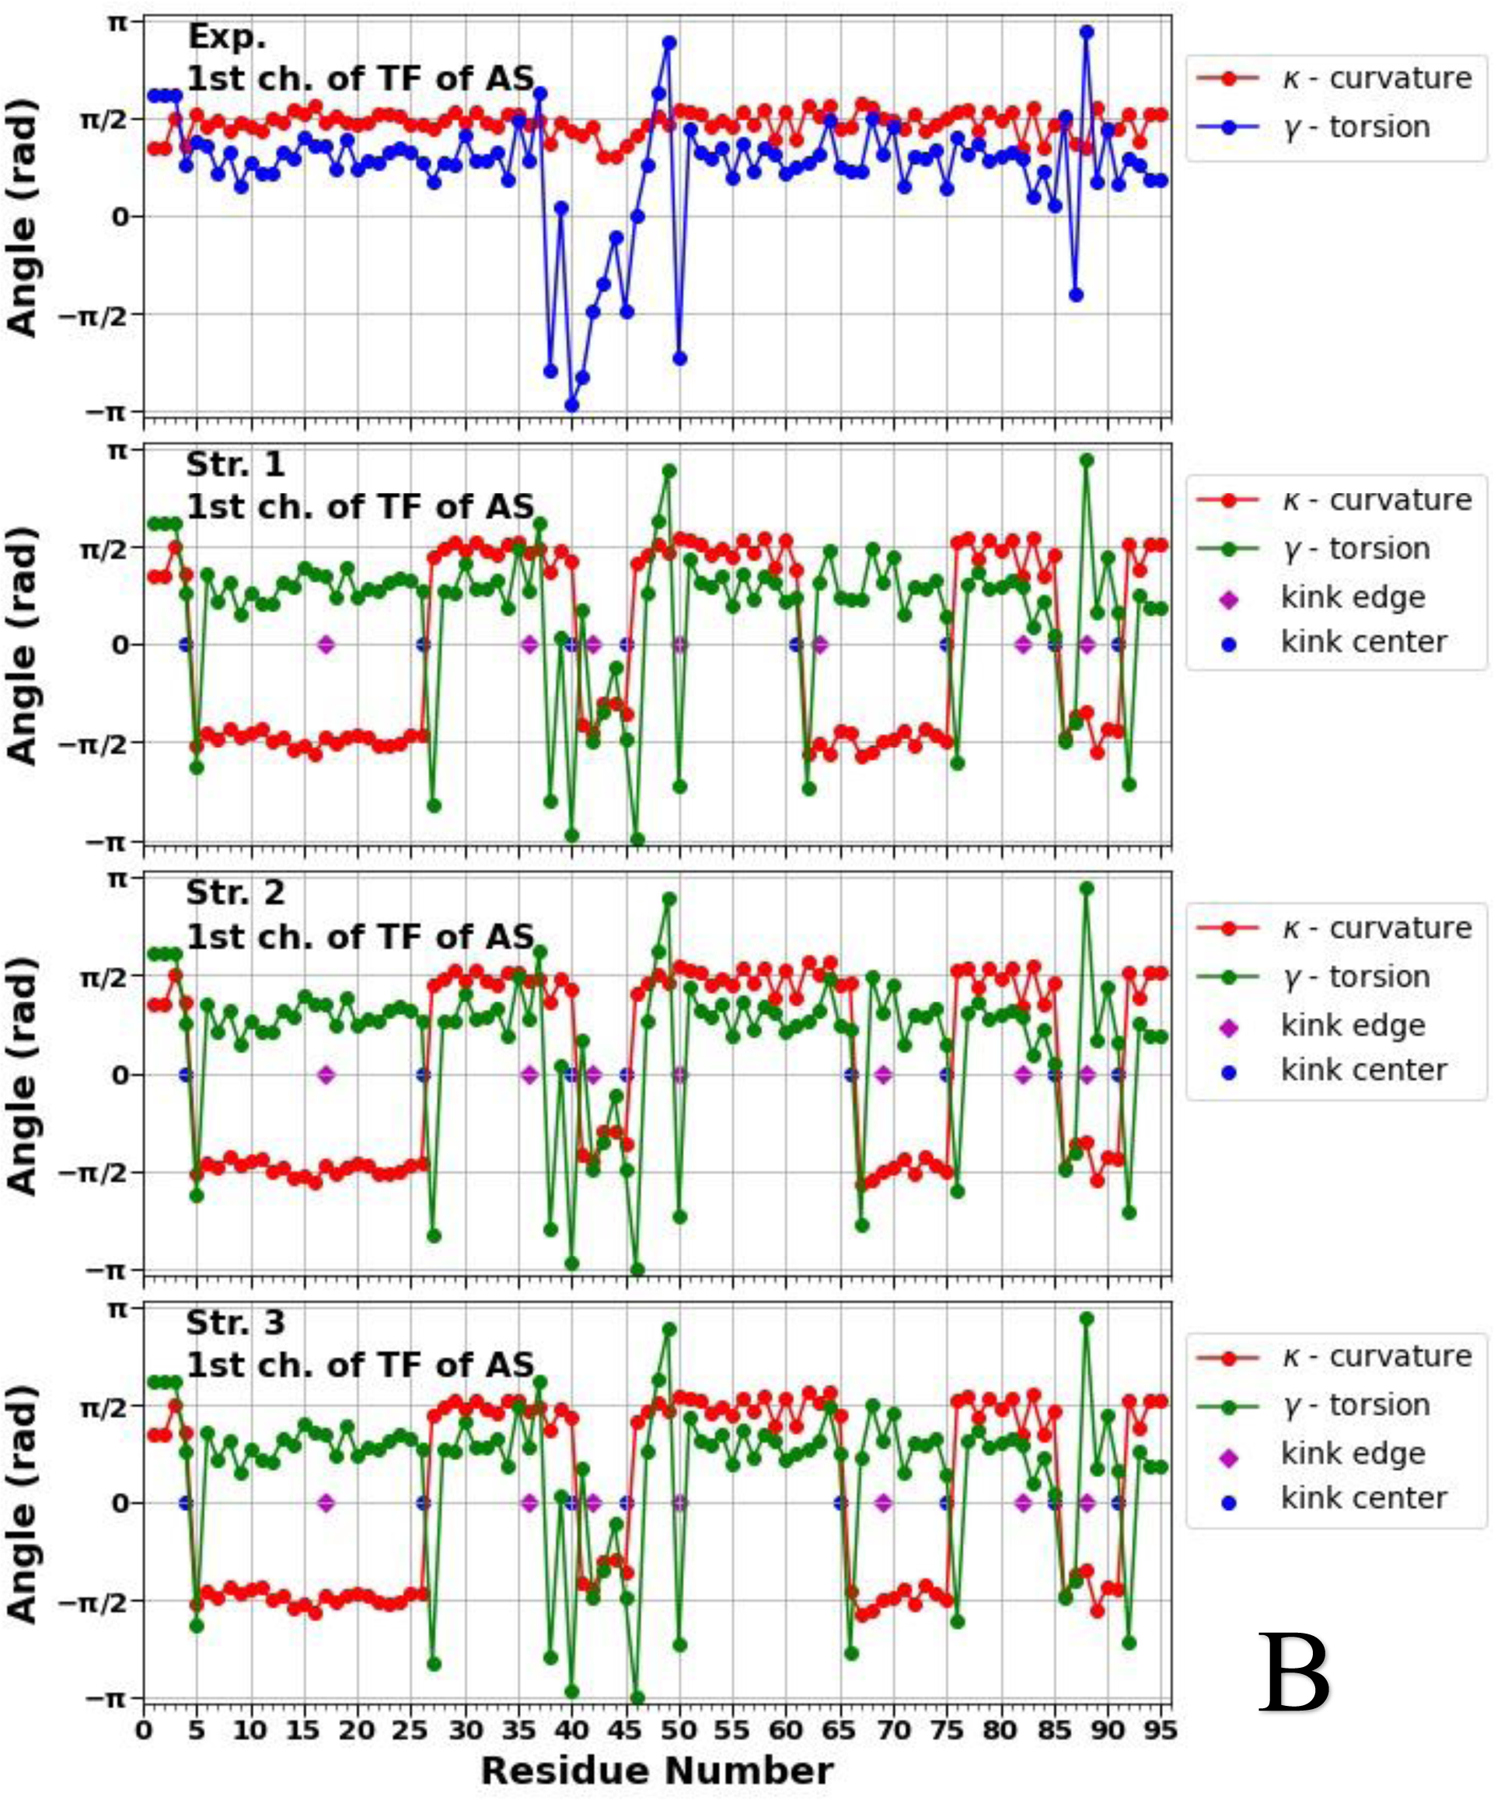
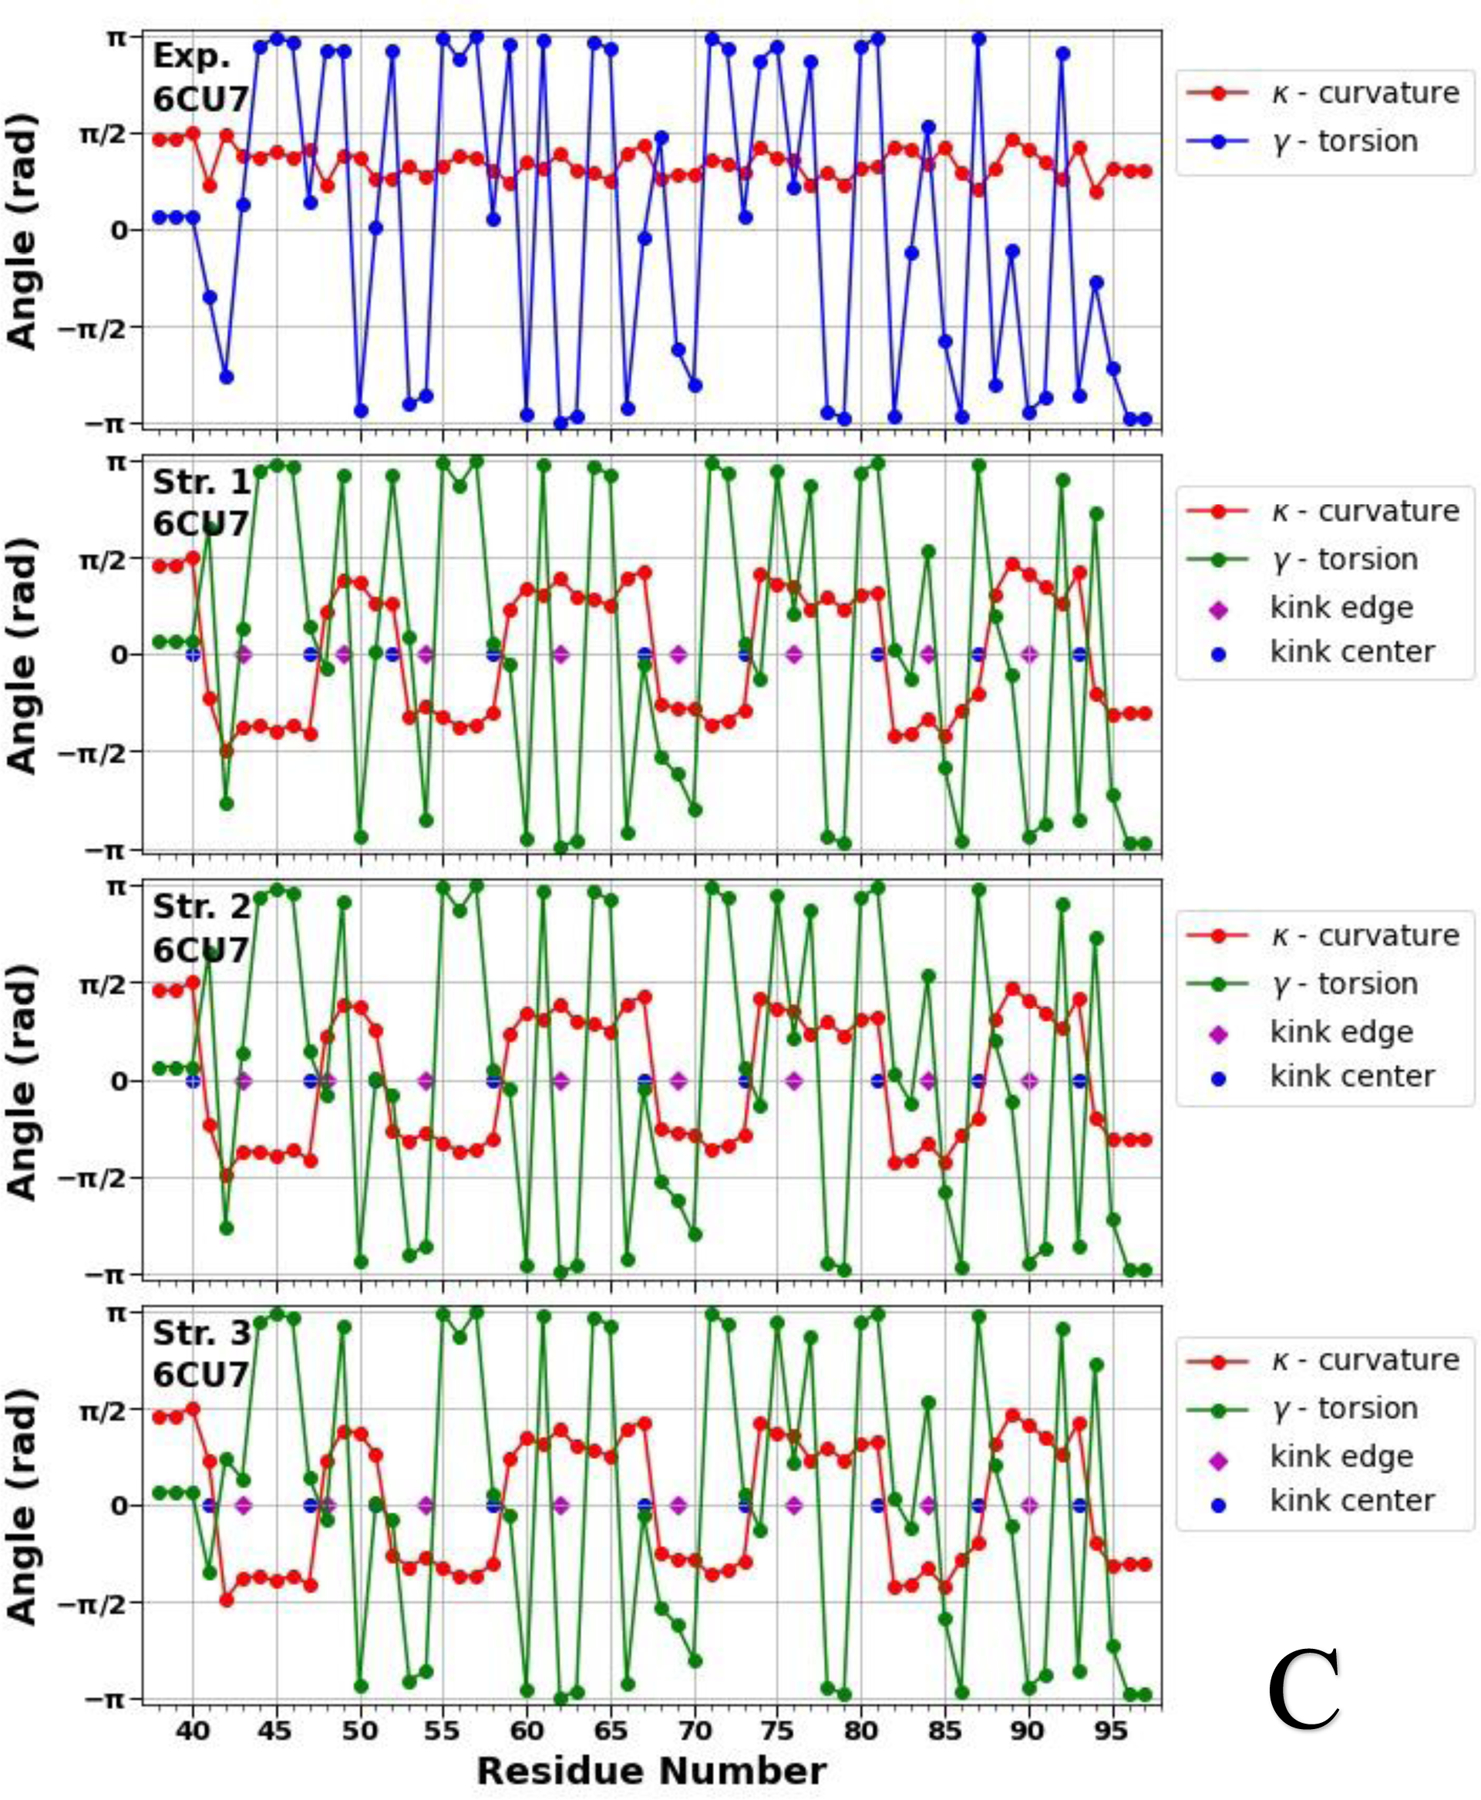
Figure 2.


Top panels of A, B and C represent experimental values of the virtual-bond κi (red) and torsion γi (blue) angle spectra of the micelle-bound (panel A), tetrameric (panel B) and fibrillar (panel C) αS. Remaining three panels in A, B and C illustrate kink structures, i.e., the virtual-bond κi (red) and torsion γi (green) angle spectra for three selected structures of the micelle-bound (panel A), tetrameric (panel B) and fibrillar (panel C) αS, after ℤ2 gauge transformation [Eq. (S8)] was made. Blue circles represent centers of kinks, purple rhombuses represent the right edges of left kinks.
