Fig. 3.

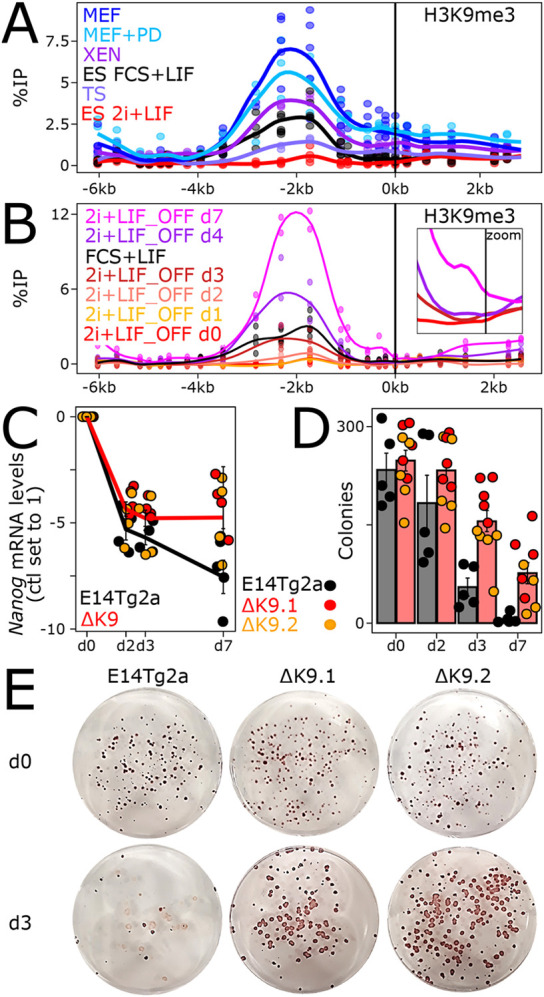
H3K9me3 at Nanog times commitment into differentiation. (A) H3K9me3 profile across the Nanog locus, presented as in Fig. 1C, in the indicated cell lines and conditions. The enrichment of H3K9me3 at either the IR (from −3.5 kb to −0.9 kb) or the promoter region (from −0.5 kb to 0 kb) in non-pluripotent cells was compared with 2i+LIF ESCs with unpaired one-tailed Student's t-test combining all individual primers falling in each subregion (P=0.002566 and 2.307e−06 for IR and promoter, respectively, for TSCs; P=0.001053 and 4.716e−06 for XEN cells; P=4.878e−08 and 3.79e−09 for MEFs). (B) Identical profiles for ESCs undergoing differentiation (labelled 2i+LIF_OFF) for the indicated number of days. The same statistical analyses as in A showed that the enrichment at the IR and promoter region was statistically significant from day 3 onwards (P=0.00226, 0.0001353, 0.0004633 for the IR, and P=0.04536, 0.0004678, 0.002106 for the promoter, at days 3, 4 and 7, respectively). The inset focuses on the promoter region (−1 kb to 0.5 kb) to better appreciate H3K9me3 spreading from day 0 to day 3, 4 and 7. (C) Nanog log2 relative mRNA levels (day 0 set to 1) measured by RT-qPCR and normalised to Tbp, during ESC differentiation in the indicated cell lines. Each dot represents an independent replicate and the line the corresponding mean with s.e.m. The comparative analysis of the temporal reduction of Nanog between E14Tg2a and ΔK9 clones (unpaired one-tailed Student's t-test) showed that it was statistically significant only at day 7 (P=0.08368, 0.05471 and 0.01324 at days 2, 3 and 7, respectively). Moreover, the reduction observed for E14Tg2a between days 3 and 7 was also found to be significant (P=0.03026). (D) Number of alkaline phosphatase-positive colonies obtained after switching to 2i+LIF for wild-type (E14Tg2a, black) and ΔK9 (red and orange) cells seeded clonally and differentiated for the number of days indicated on the x-axis. Each dot represents an independent replicate and the histogram the corresponding mean and s.e.m. Differences in clonogenicity were assessed with a Mann–Whitney test (P=0.2198, 0.001332, 0.002531 for days 2, 3 and 7, respectively). (E) Representative alkaline phosphatase staining of ESC colonies cultured in 2i+LIF after 0 (top) or 3 (bottom) days of differentiation for the indicated cell lines. d, day.
