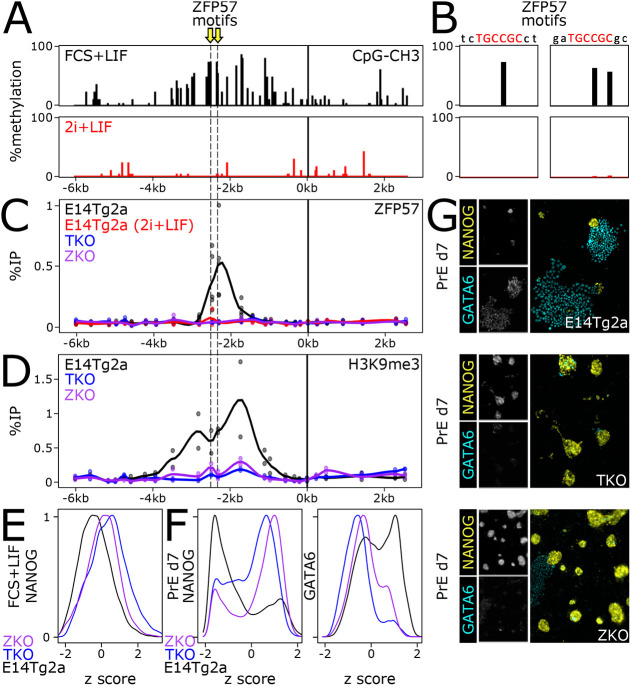
Fig. 6.
DNA methylation and ZFP57 binding drive H3K9me3 enrichment at Nanog. (A) Analysis of DNA methylation at the Nanog locus, using available datasets in ESCs cultured in FCS+LIF or in 2i+LIF. The position of two ZFP57 motifs is indicated by yellow arrows. (B) Identical analysis but focusing at the two ZFP57 motifs. (C) Analysis of ZFP57 binding by ChIP-qPCR, presented as in Fig. 1C, in the indicated cell lines: E14Tg2a cultured in FCS+LIF (black) or in 2i+LIF (red), triple-negative DNMT knockout ESCs (TKO, blue) and Zfp57 knockout ESCs (ZKO, purple). (D) Analysis of H3K9me3 at Nanog in E14Tg2a, TKO and ZKO ESCs cultured in FCS+LIF, presented as in C. (E) Analysis of NANOG expression in E14Tg2a, TKO and ZKO ESCs. The differential distribution in TKO and ZKO versus E14Tg2a was assessed with Kolmogorov–Smirnov tests (P<2.2e−16). (F) Analysis of NANOG and GATA6 expression after 7 days of directed differentiation of E14Tg2a, TKO and ZKO into primitive endoderm. Differences in distribution levels were assessed with Kolmogorov–Smirnov tests (P<2.2e−16 for both TKO and ZKO versus E14Tg2a). (G) Representative immunostaining of E14Tg2a, TKO and ZKO subjected to a directed differentiation protocol into primitive endoderm. Insets show individual signals, and main panels merged signals.

