Figure 3.

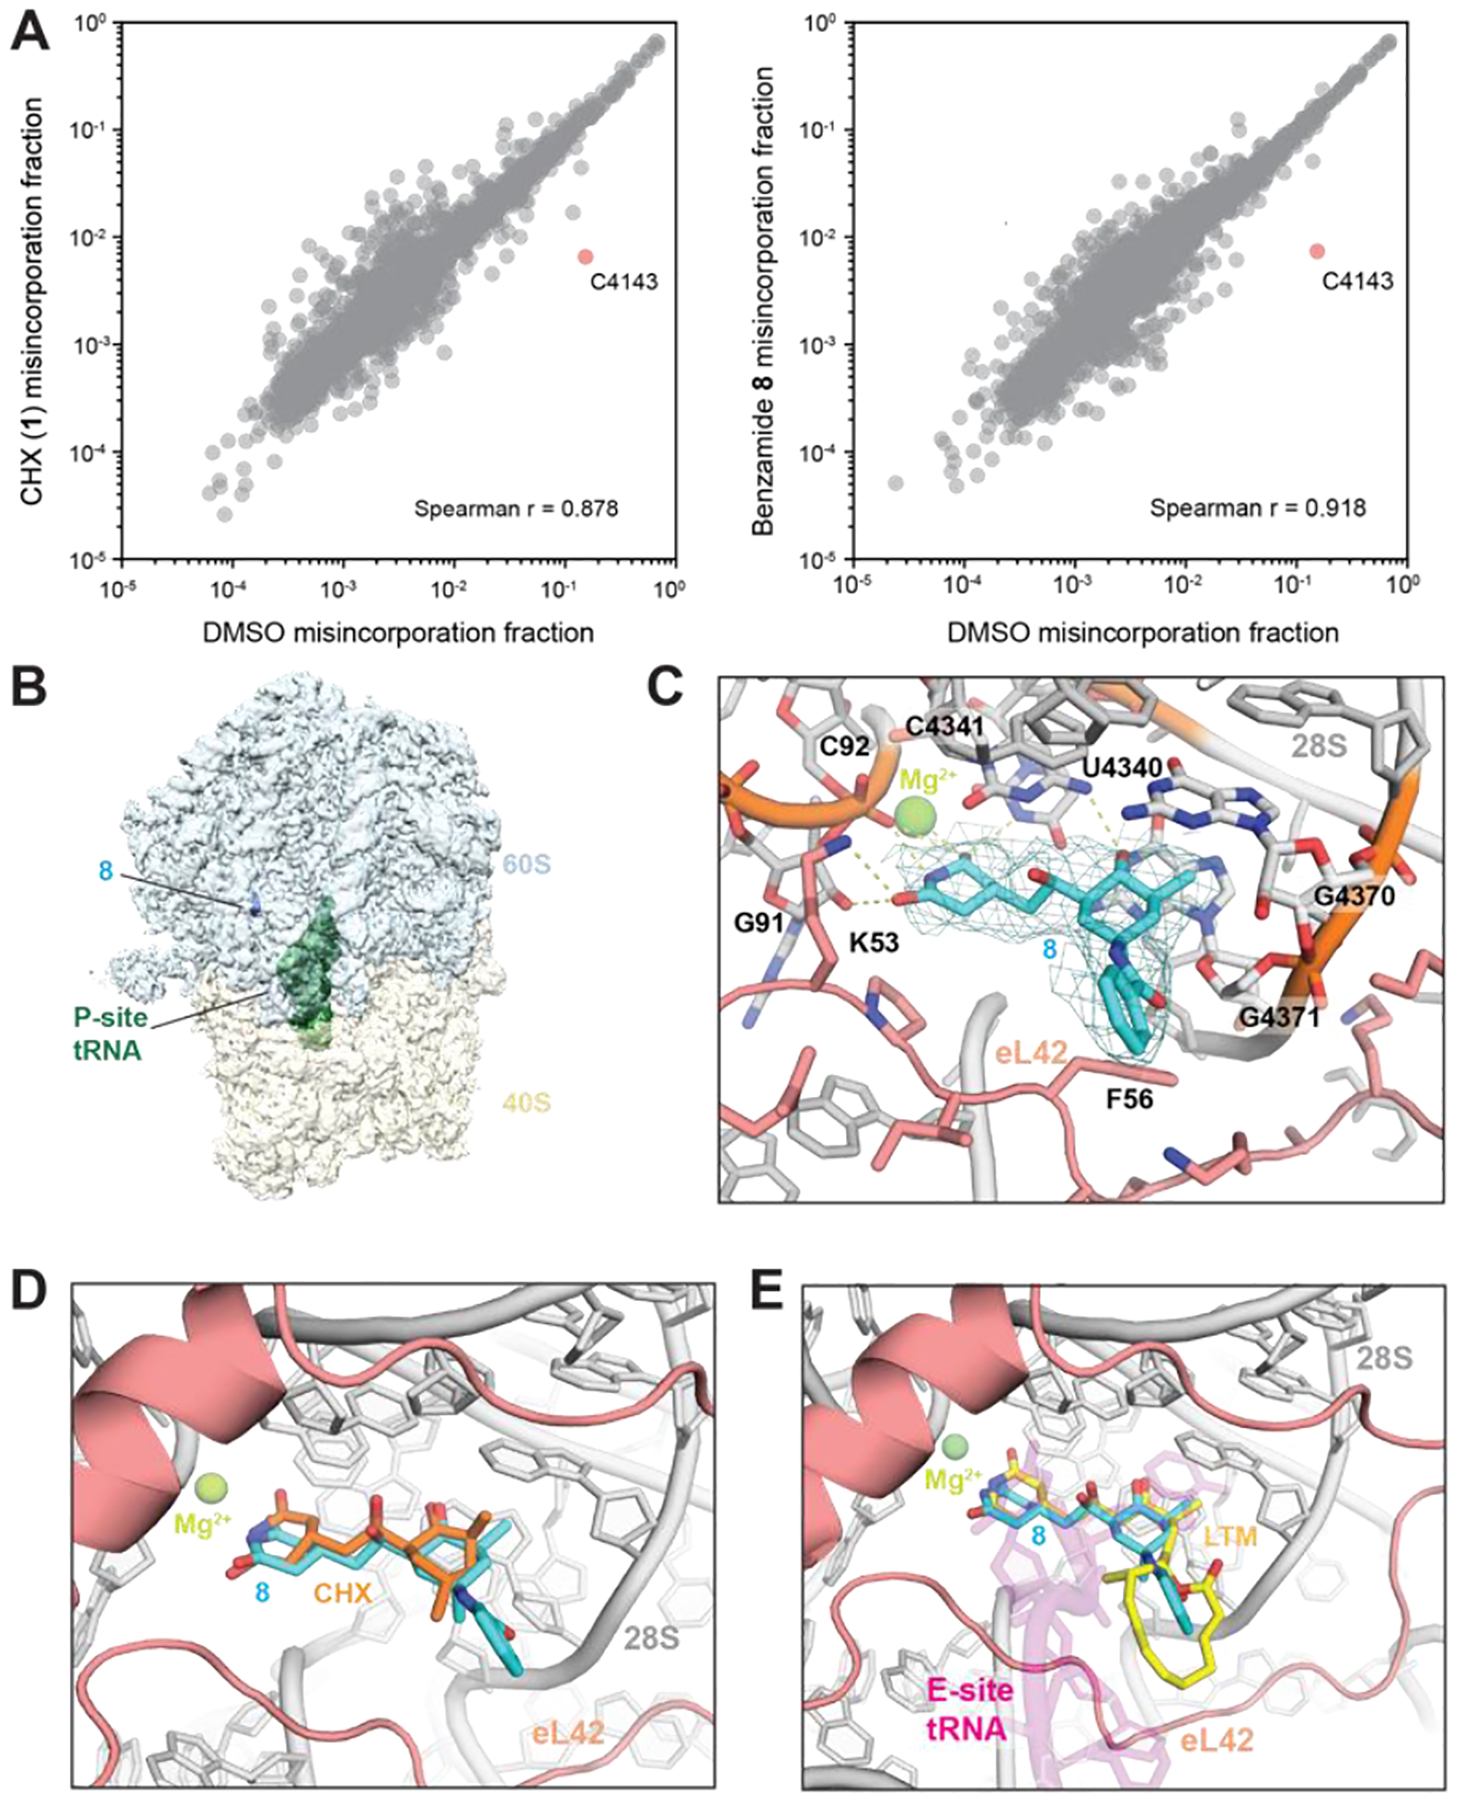
(A) Scatter plots showing DMS-induced mutation rates of 28S and 18S rRNAs comparing pretreatment with CHX (left) or 8 (right) relative to DMSO. (B) Density map overview of non-rotated 80S•8•P-tRNA. (C) Closeup view of the binding site in the 80S•8•P-tRNA model with the map (sigma=2.0). H-bonds are shown as dotted lines. rRNA:gray; eL42:salmon; 8:cyan. Important residues are shown in stick representation. (D) Overlay of the 80S•8•P-tRNA model with the H. sapiens 80S•CHX structure (PDB 5lks). (E) Overlay of the 80S•8•P-tRNA model with the O. cuniculus 80S•P-tRNA•E-tRNA structure (5lzu) and with the S. cerevisiae 80S•LTM structure (4u4r). P-tRNA:magenta; LTM:yellow.
